3 Results Multi-species indices

3.1 All vascular plant species

The MSI based on all (modeled) vascular plant species is reported here only for completeness, but it should be noted that it is not a useful overall measure of change. Indeed, when comparing this with the more focused MSI’s for specific sets of species and with the numbers of species that had an increase or decrease (last year versus first year - as indicated on the right hand side of the figures), it is clear that the overall multi-species index averages out opposing underlying trends. Moreover, in general, if a species shows an increasing trend (or decreasing trend), we cannot tell if this is to be evaluated as a positive or a negative thing without consideration of the species traits and the environmental changes that caused the species to increase or decline. For instance, an invasive plant species may show a strong increasing (‘positive’) trend, but will be evaluated as negative because of its potential negative impact on native plant and animal communities. Similarly, a native, competitive, nitrogen-demanding plant species with an increasing (‘positive’) trend, could be a consequence of high levels of atmospheric nitrogen-deposition and thus be evaluated as negative.

Evolution of the flora based on those species for which data between 1950 and 2018 were available. The index uses 2000 as baseline year.

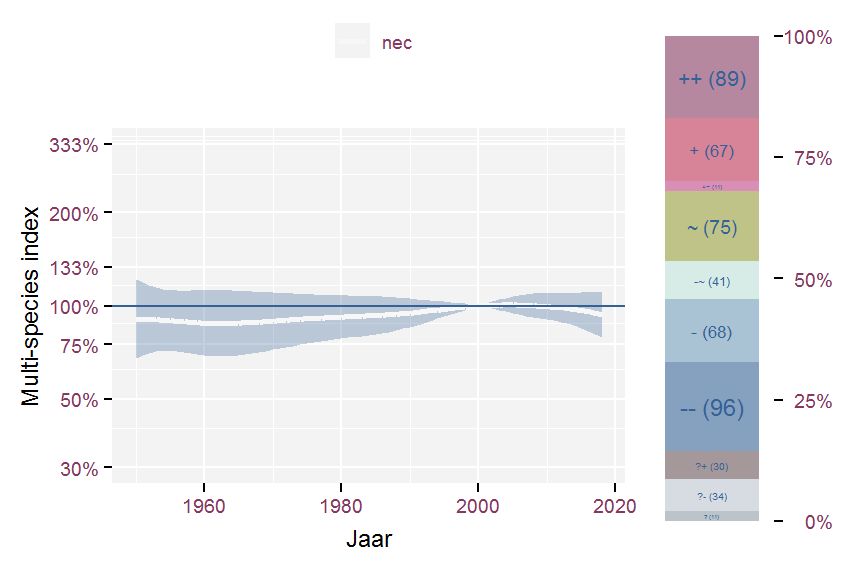
Figure 3.1: Evolution of the flora based on those species for which data between 1950 and 2018 were available. The index uses 2000 as baseline year.

Evolution of the flora based on those species for which data between 1990 and 2018 were available. The index uses 2000 as baseline year.

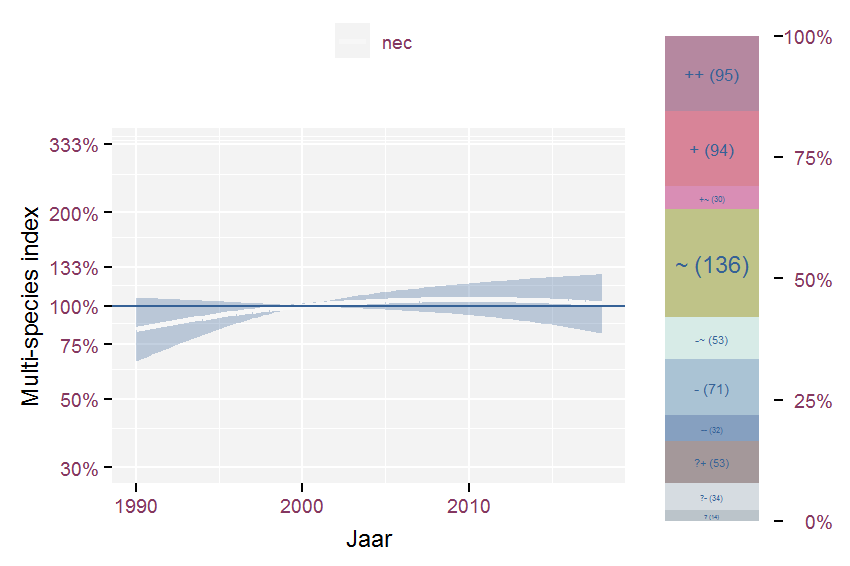
Figure 3.2: Evolution of the flora based on those species for which data between 1990 and 2018 were available. The index uses 2000 as baseline year.

3.2 Broad habitat preference

3.2.1 arable land

Multi-species index for species belonging to broad habitat preference arable land and period 1950-2018. The index uses 2000 as baseline year.

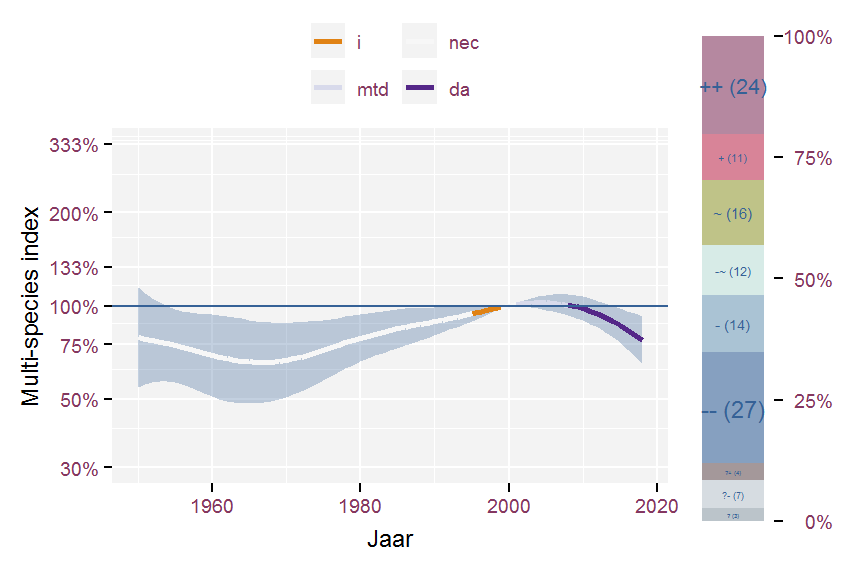
Figure 3.3: Multi-species index for species belonging to broad habitat preference arable land and period 1950-2018. The index uses 2000 as baseline year.

Table 3.1: Corresponding list of species for broad habitat preference arable land together with their effect classification for the final year compared to 1950.
Multi-species index for species groups belonging to broad habitat preference arable land and period 1990-2018. The index uses 2000 as baseline year.

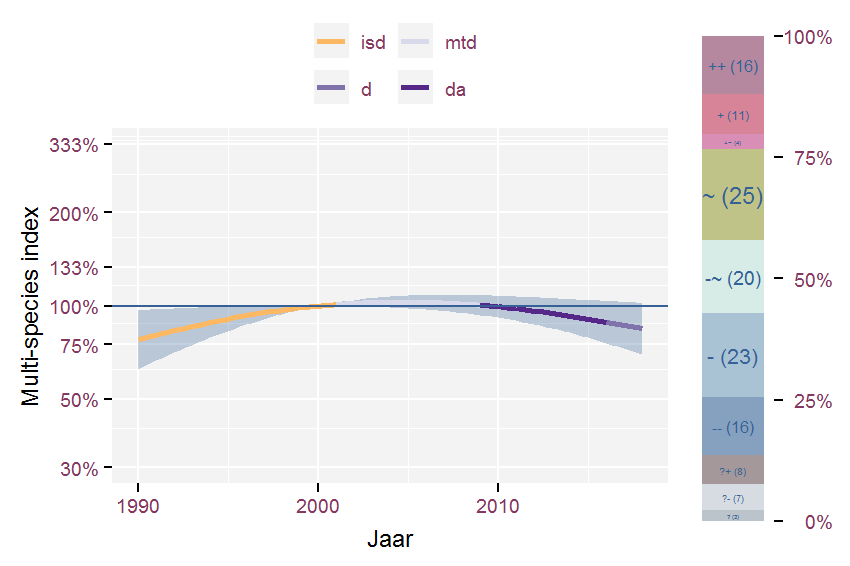
Figure 3.4: Multi-species index for species groups belonging to broad habitat preference arable land and period 1990-2018. The index uses 2000 as baseline year.

Table 3.2: Corresponding list of species for broad habitat preference arable land together with their effect classification for the final year compared to 1990.

3.2.2 coastal dunes

Multi-species index for species belonging to broad habitat preference coastal dunes and period 1950-2018. The index uses 2000 as baseline year.

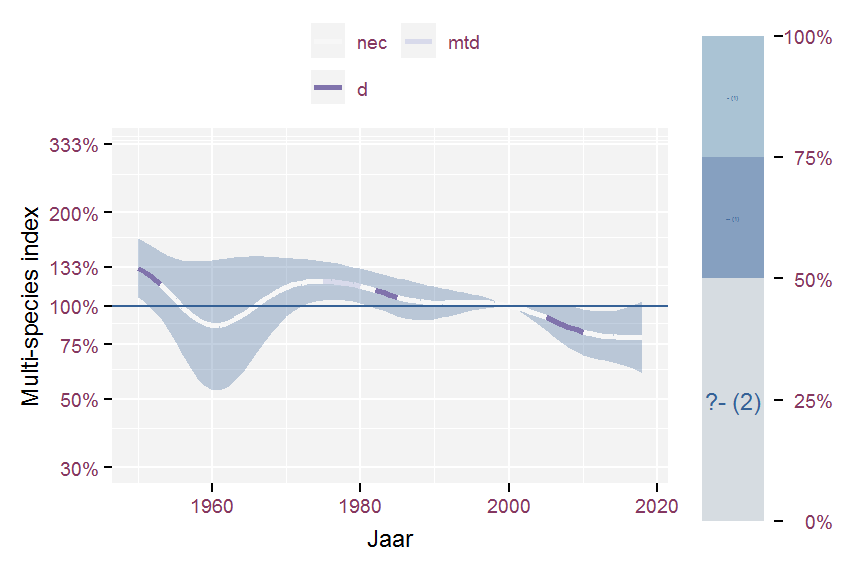
Figure 3.5: Multi-species index for species belonging to broad habitat preference coastal dunes and period 1950-2018. The index uses 2000 as baseline year.

Table 3.3: Corresponding list of species for broad habitat preference coastal dunes together with their effect classification for the final year compared to 1950.
Multi-species index for species groups belonging to broad habitat preference coastal dunes and period 1990-2018. The index uses 2000 as baseline year.

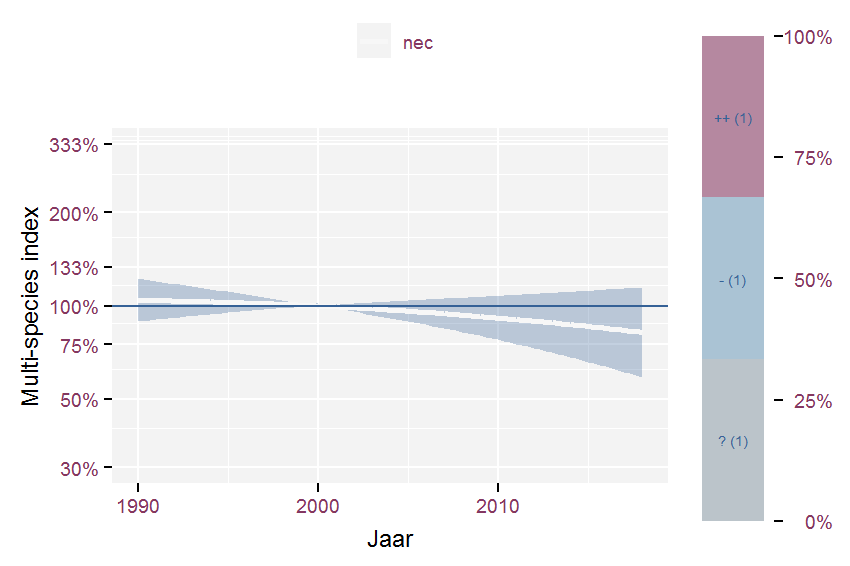
Figure 3.6: Multi-species index for species groups belonging to broad habitat preference coastal dunes and period 1990-2018. The index uses 2000 as baseline year.

Table 3.4: Corresponding list of species for broad habitat preference coastal dunes together with their effect classification for the final year compared to 1990.

3.2.3 forest

Multi-species index for species belonging to broad habitat preference forest and period 1950-2018. The index uses 2000 as baseline year.

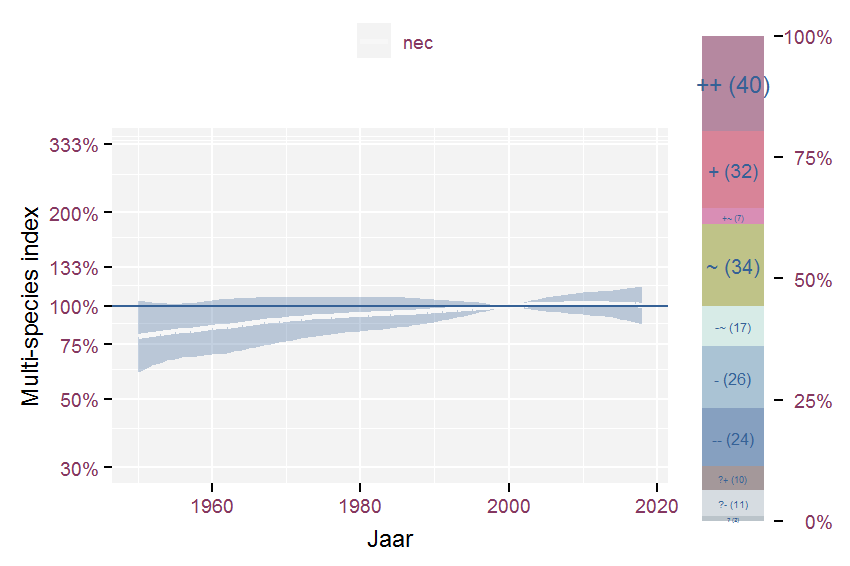
Figure 3.7: Multi-species index for species belonging to broad habitat preference forest and period 1950-2018. The index uses 2000 as baseline year.

Table 3.5: Corresponding list of species for broad habitat preference forest together with their effect classification for the final year compared to 1950.
Multi-species index for species groups belonging to broad habitat preference forest and period 1990-2018. The index uses 2000 as baseline year.

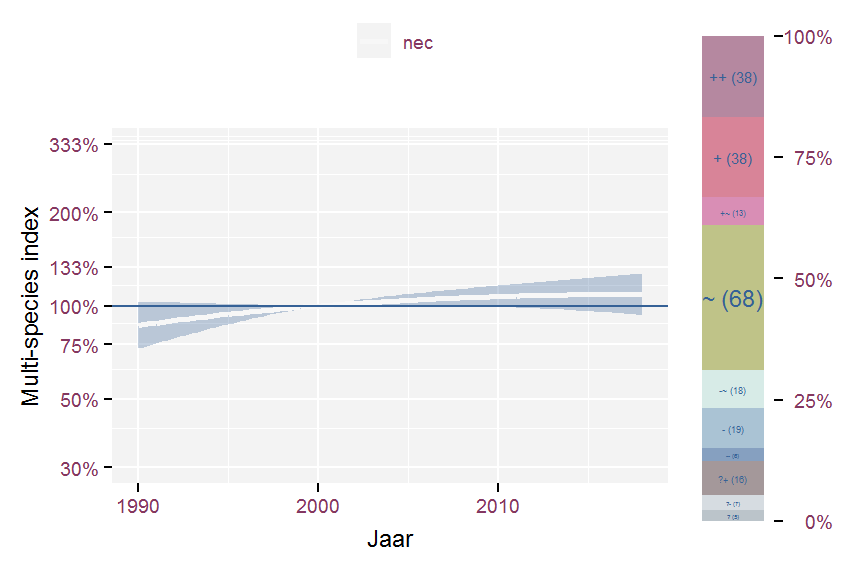
Figure 3.8: Multi-species index for species groups belonging to broad habitat preference forest and period 1990-2018. The index uses 2000 as baseline year.

Table 3.6: Corresponding list of species for broad habitat preference forest together with their effect classification for the final year compared to 1990.

3.2.4 freshwater habitats

Multi-species index for species belonging to broad habitat preference freshwater habitats and period 1950-2018. The index uses 2000 as baseline year.

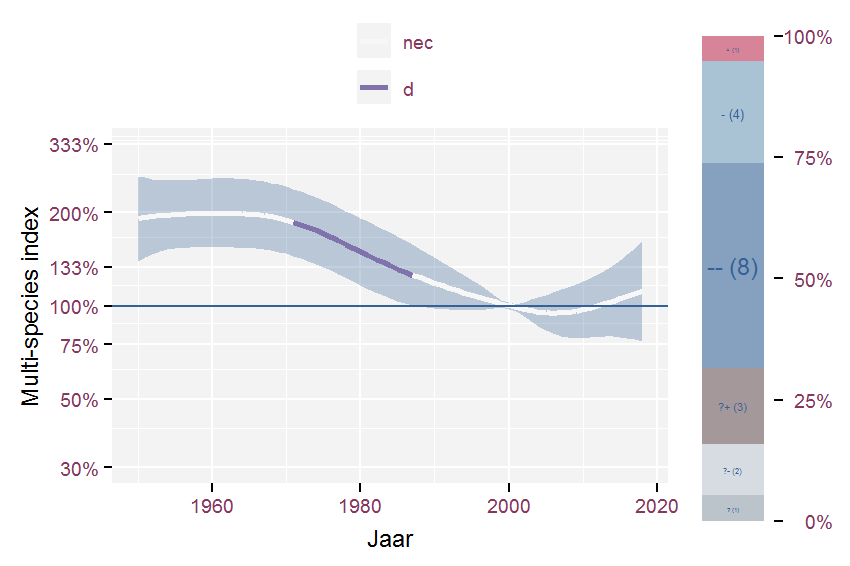
Figure 3.9: Multi-species index for species belonging to broad habitat preference freshwater habitats and period 1950-2018. The index uses 2000 as baseline year.

Table 3.7: Corresponding list of species for broad habitat preference freshwater habitats together with their effect classification for the final year compared to 1950.
Multi-species index for species groups belonging to broad habitat preference freshwater habitats and period 1990-2018. The index uses 2000 as baseline year.

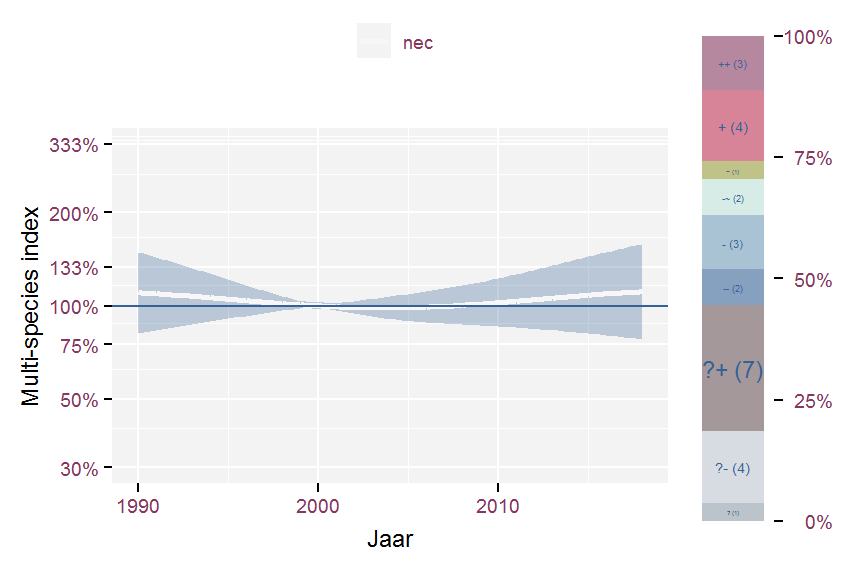
Figure 3.10: Multi-species index for species groups belonging to broad habitat preference freshwater habitats and period 1990-2018. The index uses 2000 as baseline year.

Table 3.8: Corresponding list of species for broad habitat preference freshwater habitats together with their effect classification for the final year compared to 1990.

3.2.5 grassland

Multi-species index for species belonging to broad habitat preference grassland and period 1950-2018. The index uses 2000 as baseline year.

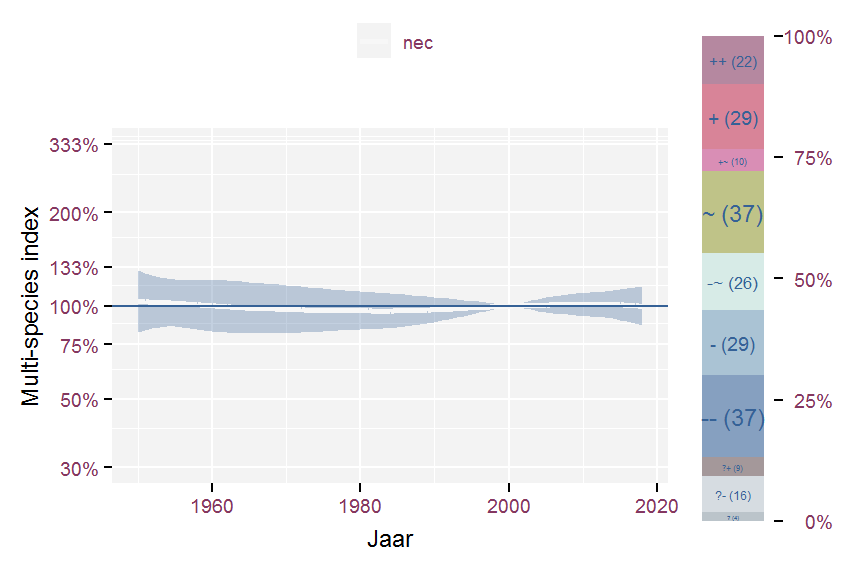
Figure 3.11: Multi-species index for species belonging to broad habitat preference grassland and period 1950-2018. The index uses 2000 as baseline year.

Table 3.9: Corresponding list of species for broad habitat preference grassland together with their effect classification for the final year compared to 1950.
Multi-species index for species groups belonging to broad habitat preference grassland and period 1990-2018. The index uses 2000 as baseline year.

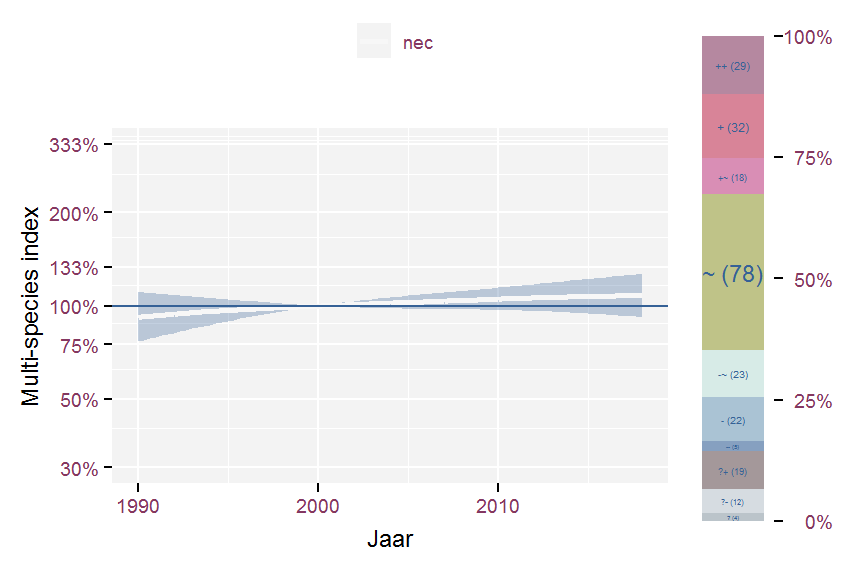
Figure 3.12: Multi-species index for species groups belonging to broad habitat preference grassland and period 1990-2018. The index uses 2000 as baseline year.

Table 3.10: Corresponding list of species for broad habitat preference grassland together with their effect classification for the final year compared to 1990.

3.2.6 heathland

Multi-species index for species belonging to broad habitat preference heathland and period 1950-2018. The index uses 2000 as baseline year.

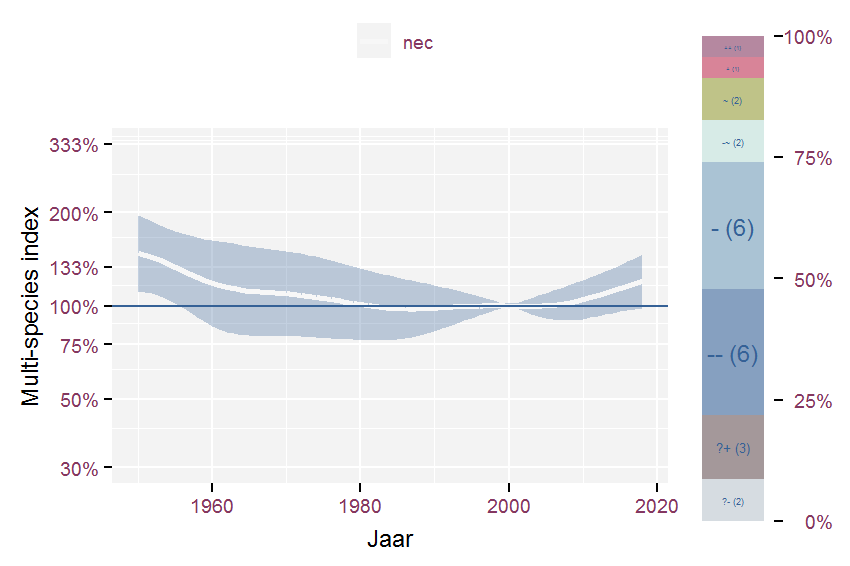
Figure 3.13: Multi-species index for species belonging to broad habitat preference heathland and period 1950-2018. The index uses 2000 as baseline year.

Table 3.11: Corresponding list of species for broad habitat preference heathland together with their effect classification for the final year compared to 1950.
Multi-species index for species groups belonging to broad habitat preference heathland and period 1990-2018. The index uses 2000 as baseline year.

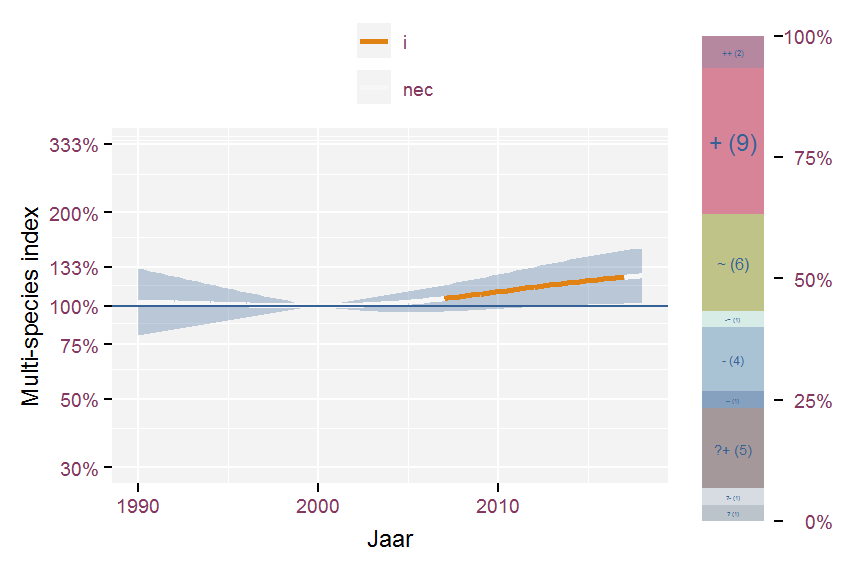
Figure 3.14: Multi-species index for species groups belonging to broad habitat preference heathland and period 1990-2018. The index uses 2000 as baseline year.

Table 3.12: Corresponding list of species for broad habitat preference heathland together with their effect classification for the final year compared to 1990.

3.2.7 marshes

Multi-species index for species belonging to broad habitat preference marshes and period 1950-2018. The index uses 2000 as baseline year.

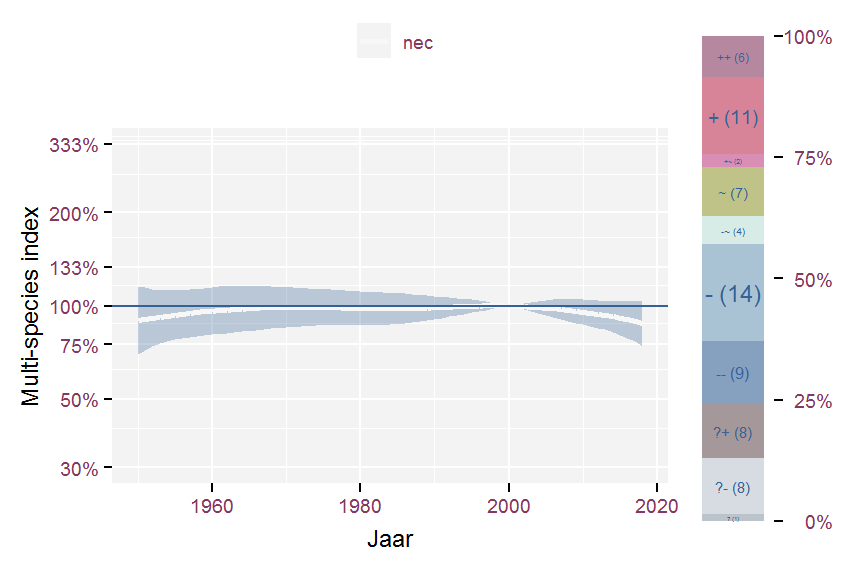
Figure 3.15: Multi-species index for species belonging to broad habitat preference marshes and period 1950-2018. The index uses 2000 as baseline year.

Table 3.13: Corresponding list of species for broad habitat preference marshes together with their effect classification for the final year compared to 1950.
Multi-species index for species groups belonging to broad habitat preference marshes and period 1990-2018. The index uses 2000 as baseline year.

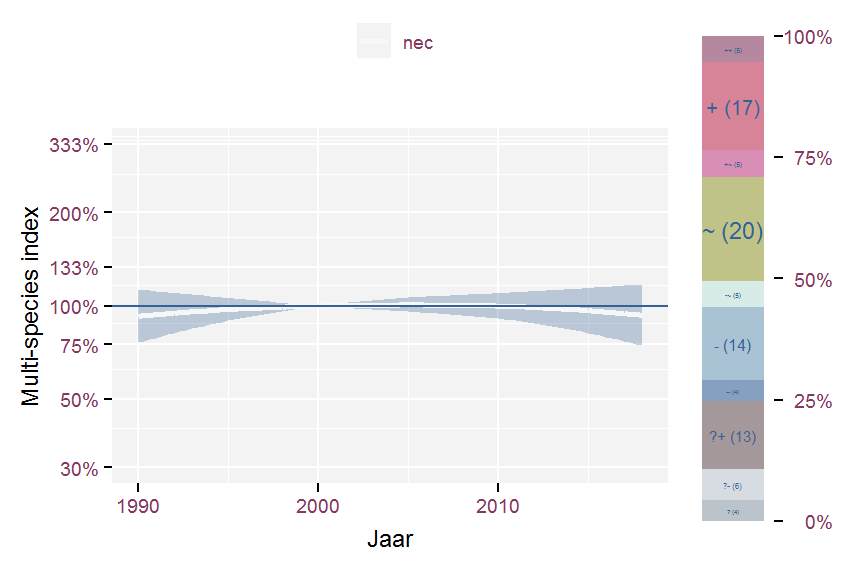
Figure 3.16: Multi-species index for species groups belonging to broad habitat preference marshes and period 1990-2018. The index uses 2000 as baseline year.

Table 3.14: Corresponding list of species for broad habitat preference marshes together with their effect classification for the final year compared to 1990.

3.2.8 saline and brackish habitats

Multi-species index for species belonging to broad habitat preference saline and brackish habitats and period 1950-2018. The index uses 2000 as baseline year.

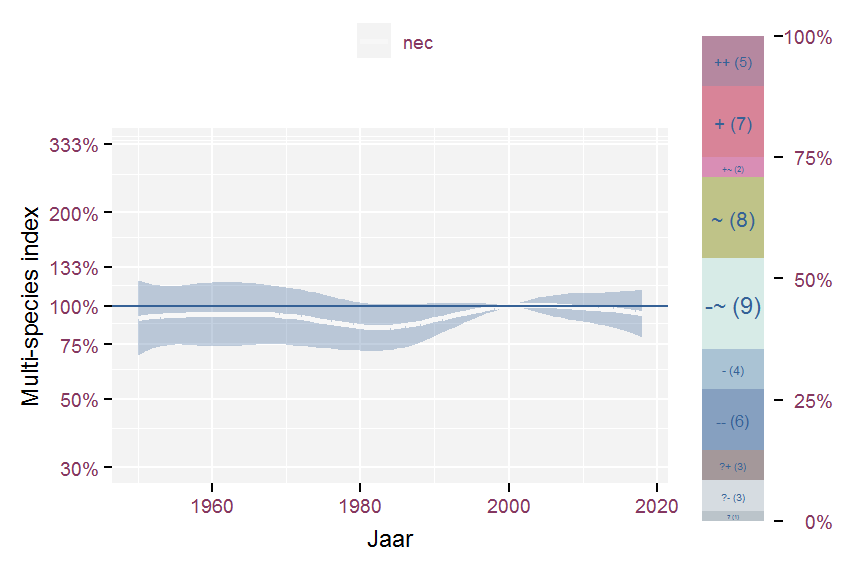
Figure 3.17: Multi-species index for species belonging to broad habitat preference saline and brackish habitats and period 1950-2018. The index uses 2000 as baseline year.

Table 3.15: Corresponding list of species for broad habitat preference saline and brackish habitats together with their effect classification for the final year compared to 1950.
Multi-species index for species groups belonging to broad habitat preference saline and brackish habitats and period 1990-2018. The index uses 2000 as baseline year.

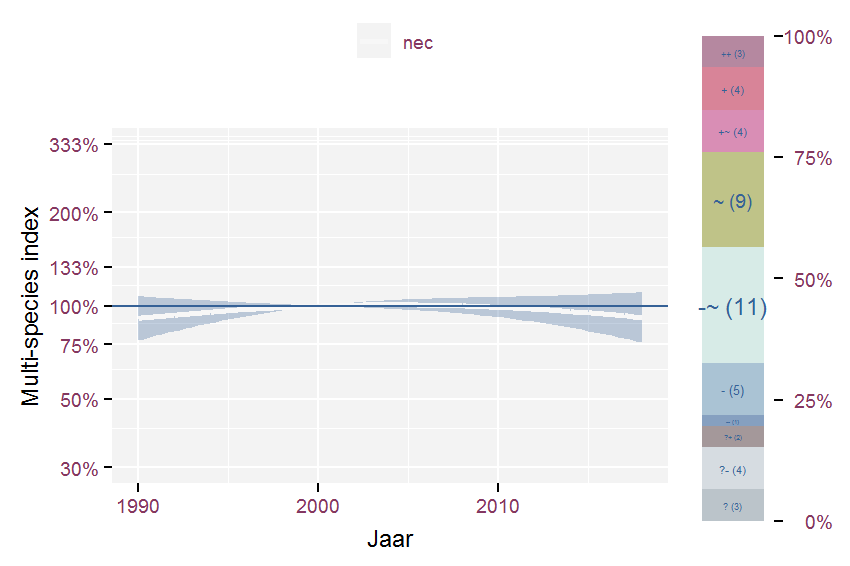
Figure 3.18: Multi-species index for species groups belonging to broad habitat preference saline and brackish habitats and period 1990-2018. The index uses 2000 as baseline year.

Table 3.16: Corresponding list of species for broad habitat preference saline and brackish habitats together with their effect classification for the final year compared to 1990.

3.2.9 urban

Multi-species index for species belonging to broad habitat preference urban and period 1950-2018. The index uses 2000 as baseline year.

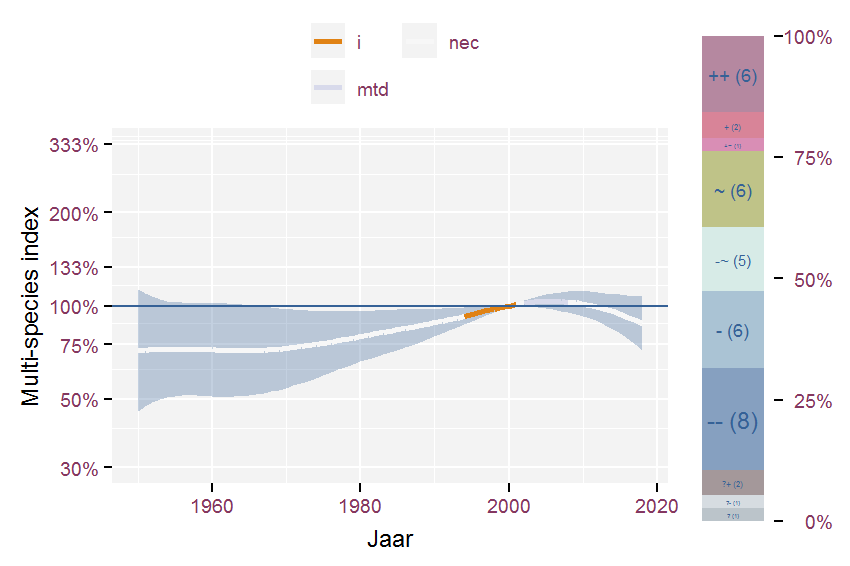
Figure 3.19: Multi-species index for species belonging to broad habitat preference urban and period 1950-2018. The index uses 2000 as baseline year.

Table 3.17: Corresponding list of species for broad habitat preference urban together with their effect classification for the final year compared to 1950.
Multi-species index for species groups belonging to broad habitat preference urban and period 1990-2018. The index uses 2000 as baseline year.

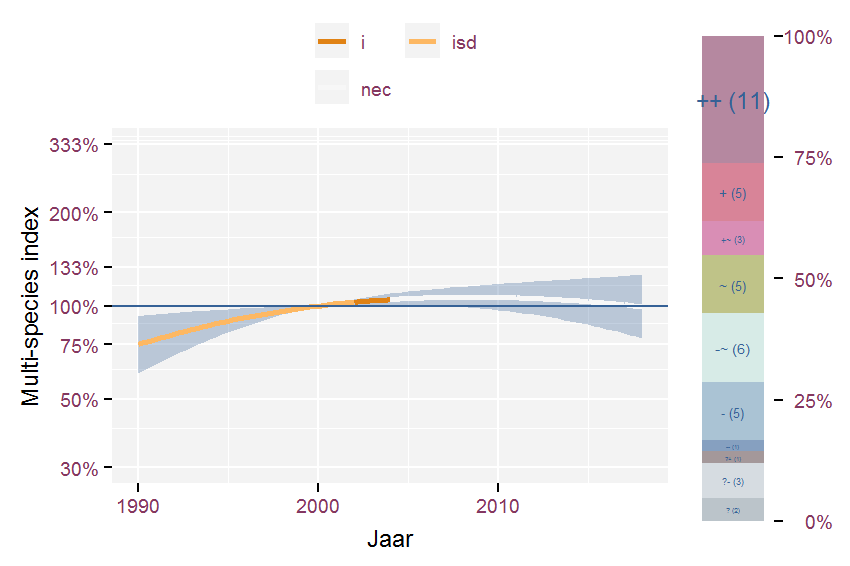
Figure 3.20: Multi-species index for species groups belonging to broad habitat preference urban and period 1990-2018. The index uses 2000 as baseline year.

Table 3.18: Corresponding list of species for broad habitat preference urban together with their effect classification for the final year compared to 1990.

3.3 Socio-ecological groups (Stieperaere and Fransen 1982)

3.3.1 alluvial forests

Multi-species index for species belonging to Socio-ecological groups (Stieperaere & Franssen 1982) alluvial forests and period 1950-2018. The index uses 2000 as baseline year.

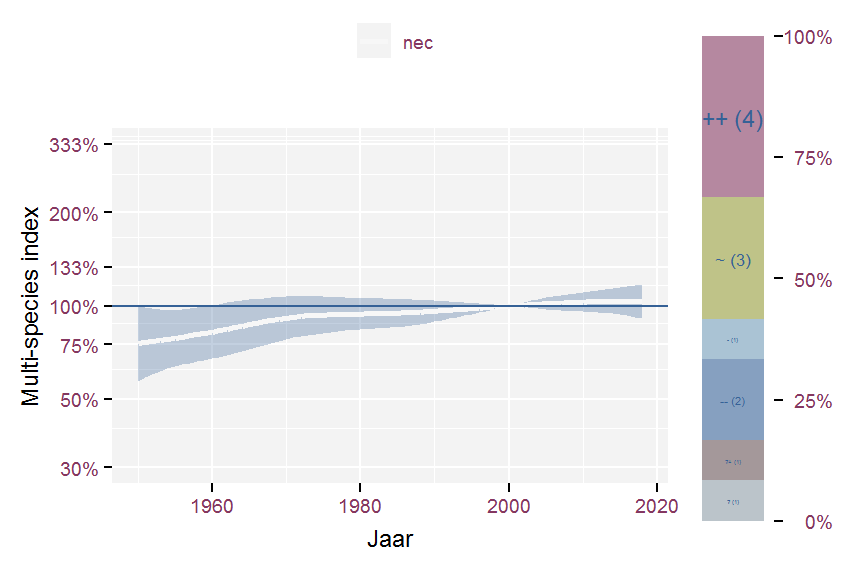
Figure 3.21: Multi-species index for species belonging to Socio-ecological groups (Stieperaere & Franssen 1982) alluvial forests and period 1950-2018. The index uses 2000 as baseline year.

Table 3.19: Corresponding list of species for Socio-ecological groups (Stieperaere & Franssen 1982) alluvial forests together with their effect classification for the final year compared to 1950.
Multi-species index for species groups belonging to Socio-ecological groups (Stieperaere & Franssen 1982) alluvial forests and period 1990-2018. The index uses 2000 as baseline year.

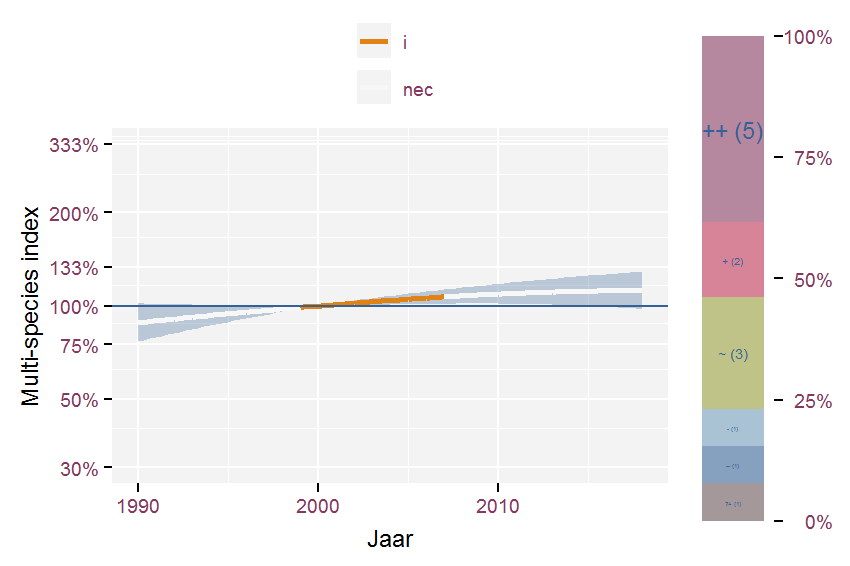
Figure 3.22: Multi-species index for species groups belonging to Socio-ecological groups (Stieperaere & Franssen 1982) alluvial forests and period 1990-2018. The index uses 2000 as baseline year.

Table 3.20: Corresponding list of species for Socio-ecological groups (Stieperaere & Franssen 1982) alluvial forests together with their effect classification for the final year compared to 1990.

3.3.2 arable land on nutrient poor acidic soils

Multi-species index for species belonging to Socio-ecological groups (Stieperaere & Franssen 1982) arable land on nutrient poor acidic soils and period 1950-2018. The index uses 2000 as baseline year.

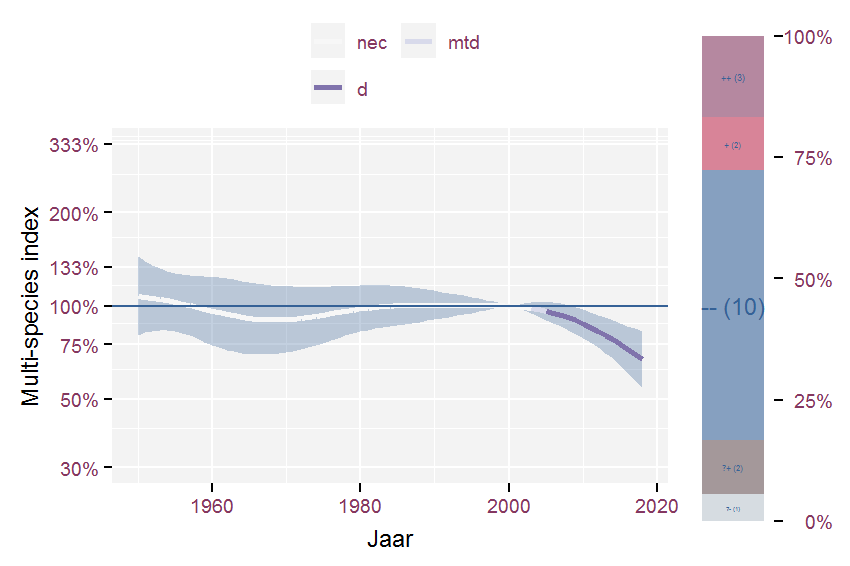
Figure 3.23: Multi-species index for species belonging to Socio-ecological groups (Stieperaere & Franssen 1982) arable land on nutrient poor acidic soils and period 1950-2018. The index uses 2000 as baseline year.

Table 3.21: Corresponding list of species for Socio-ecological groups (Stieperaere & Franssen 1982) arable land on nutrient poor acidic soils together with their effect classification for the final year compared to 1950.
Multi-species index for species groups belonging to Socio-ecological groups (Stieperaere & Franssen 1982) arable land on nutrient poor acidic soils and period 1990-2018. The index uses 2000 as baseline year.

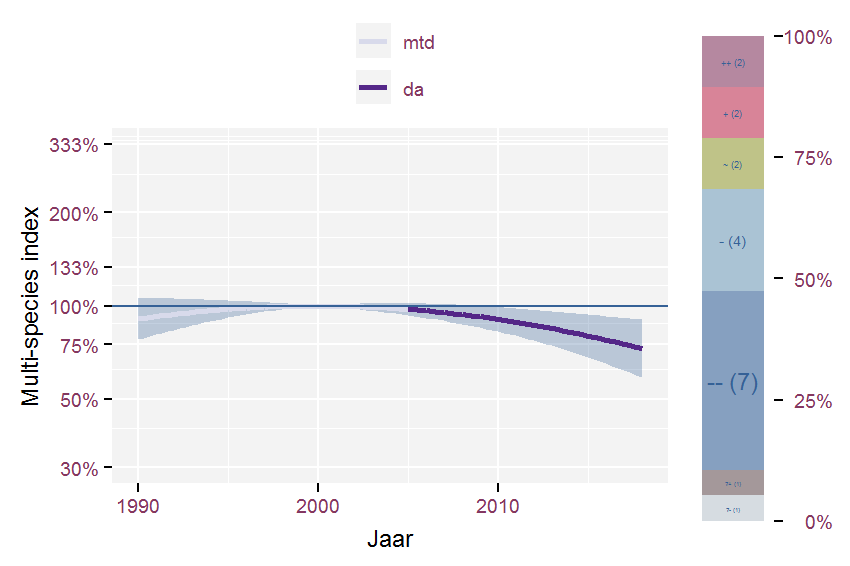
Figure 3.24: Multi-species index for species groups belonging to Socio-ecological groups (Stieperaere & Franssen 1982) arable land on nutrient poor acidic soils and period 1990-2018. The index uses 2000 as baseline year.

Table 3.22: Corresponding list of species for Socio-ecological groups (Stieperaere & Franssen 1982) arable land on nutrient poor acidic soils together with their effect classification for the final year compared to 1990.

3.3.3 arable land on nutrient rich soils but not rich in calcium

Multi-species index for species belonging to Socio-ecological groups (Stieperaere & Franssen 1982) arable land on nutrient rich soils but not rich in calcium and period 1950-2018. The index uses 2000 as baseline year.

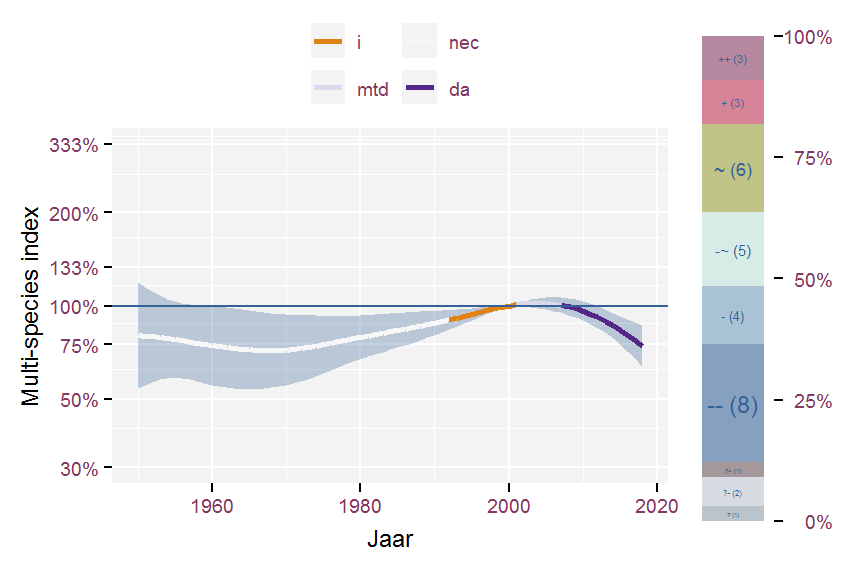
Figure 3.25: Multi-species index for species belonging to Socio-ecological groups (Stieperaere & Franssen 1982) arable land on nutrient rich soils but not rich in calcium and period 1950-2018. The index uses 2000 as baseline year.

Table 3.23: Corresponding list of species for Socio-ecological groups (Stieperaere & Franssen 1982) arable land on nutrient rich soils but not rich in calcium together with their effect classification for the final year compared to 1950.
Multi-species index for species groups belonging to Socio-ecological groups (Stieperaere & Franssen 1982) arable land on nutrient rich soils but not rich in calcium and period 1990-2018. The index uses 2000 as baseline year.

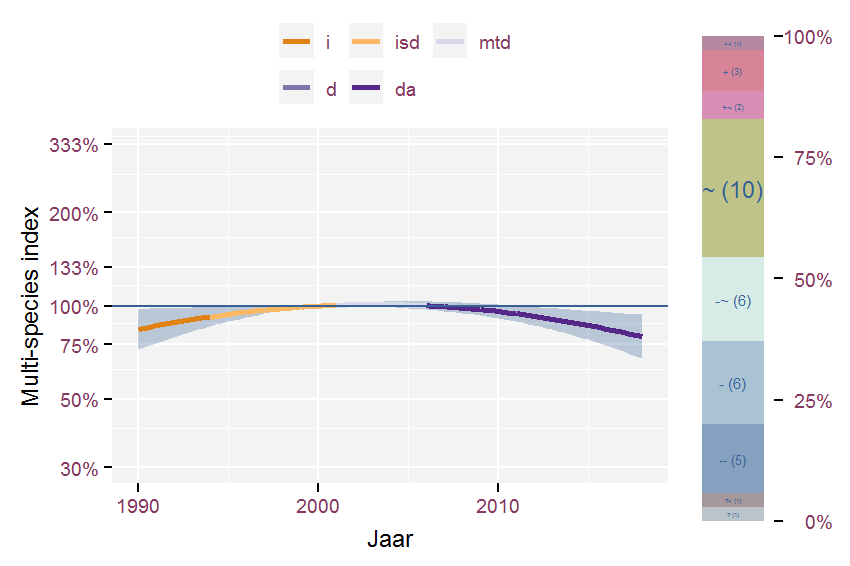
Figure 3.26: Multi-species index for species groups belonging to Socio-ecological groups (Stieperaere & Franssen 1982) arable land on nutrient rich soils but not rich in calcium and period 1990-2018. The index uses 2000 as baseline year.

Table 3.24: Corresponding list of species for Socio-ecological groups (Stieperaere & Franssen 1982) arable land on nutrient rich soils but not rich in calcium together with their effect classification for the final year compared to 1990.

3.3.4 clearcuttings on moderately moist to dry, moderately nutrient-rich to nutrient-rich soil

Multi-species index for species belonging to Socio-ecological groups (Stieperaere & Franssen 1982) clearcuttings on moderately moist to dry, moderately nutrient-rich to nutrient-rich soil and period 1950-2018. The index uses 2000 as baseline year.

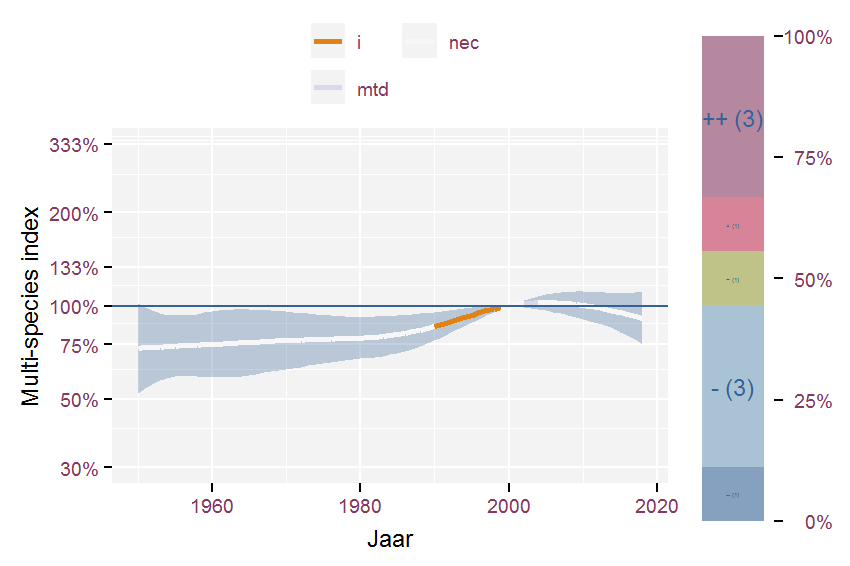
Figure 3.27: Multi-species index for species belonging to Socio-ecological groups (Stieperaere & Franssen 1982) clearcuttings on moderately moist to dry, moderately nutrient-rich to nutrient-rich soil and period 1950-2018. The index uses 2000 as baseline year.

Table 3.25: Corresponding list of species for Socio-ecological groups (Stieperaere & Franssen 1982) clearcuttings on moderately moist to dry, moderately nutrient-rich to nutrient-rich soil together with their effect classification for the final year compared to 1950.
Multi-species index for species groups belonging to Socio-ecological groups (Stieperaere & Franssen 1982) clearcuttings on moderately moist to dry, moderately nutrient-rich to nutrient-rich soil and period 1990-2018. The index uses 2000 as baseline year.

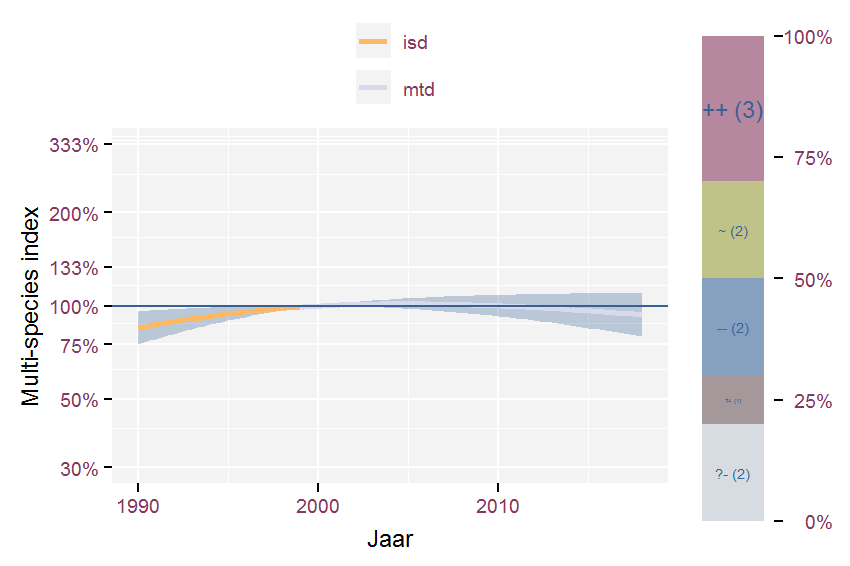
Figure 3.28: Multi-species index for species groups belonging to Socio-ecological groups (Stieperaere & Franssen 1982) clearcuttings on moderately moist to dry, moderately nutrient-rich to nutrient-rich soil and period 1990-2018. The index uses 2000 as baseline year.

Table 3.26: Corresponding list of species for Socio-ecological groups (Stieperaere & Franssen 1982) clearcuttings on moderately moist to dry, moderately nutrient-rich to nutrient-rich soil together with their effect classification for the final year compared to 1990.

3.3.5 drift lines, rough herbaceous vegetation on shores and willow shrub along rivers

Multi-species index for species belonging to Socio-ecological groups (Stieperaere & Franssen 1982) drift lines, rough herbaceous vegetation on shores and willow shrub along rivers and period 1950-2018. The index uses 2000 as baseline year.

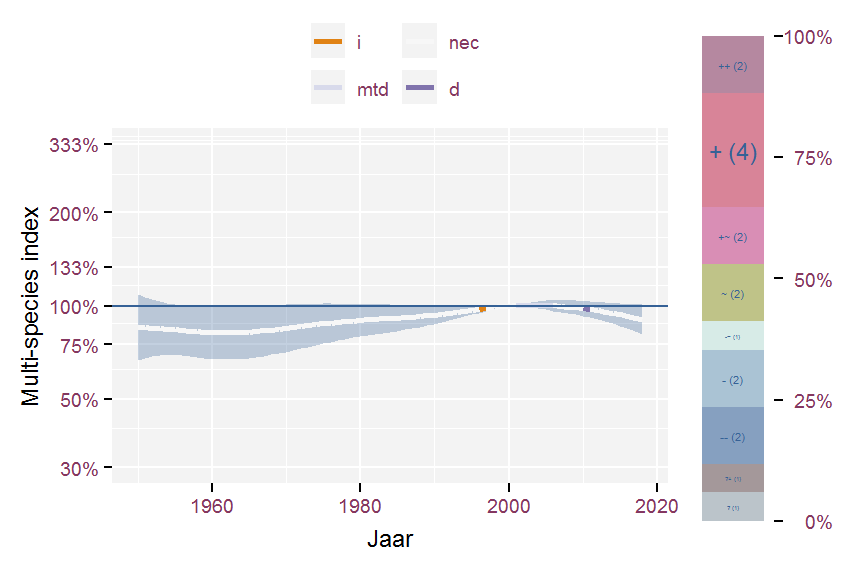
Figure 3.29: Multi-species index for species belonging to Socio-ecological groups (Stieperaere & Franssen 1982) drift lines, rough herbaceous vegetation on shores and willow shrub along rivers and period 1950-2018. The index uses 2000 as baseline year.

Table 3.27: Corresponding list of species for Socio-ecological groups (Stieperaere & Franssen 1982) drift lines, rough herbaceous vegetation on shores and willow shrub along rivers together with their effect classification for the final year compared to 1950.
Multi-species index for species groups belonging to Socio-ecological groups (Stieperaere & Franssen 1982) drift lines, rough herbaceous vegetation on shores and willow shrub along rivers and period 1990-2018. The index uses 2000 as baseline year.

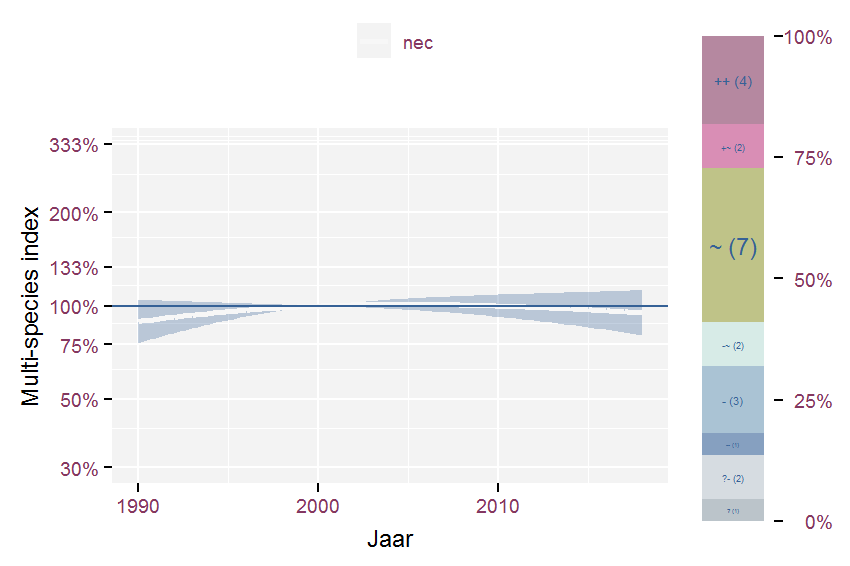
Figure 3.30: Multi-species index for species groups belonging to Socio-ecological groups (Stieperaere & Franssen 1982) drift lines, rough herbaceous vegetation on shores and willow shrub along rivers and period 1990-2018. The index uses 2000 as baseline year.

Table 3.28: Corresponding list of species for Socio-ecological groups (Stieperaere & Franssen 1982) drift lines, rough herbaceous vegetation on shores and willow shrub along rivers together with their effect classification for the final year compared to 1990.

3.3.6 dry heathland on nutrient poor soils

Multi-species index for species belonging to Socio-ecological groups (Stieperaere & Franssen 1982) dry heathland on nutrient poor soils and period 1950-2018. The index uses 2000 as baseline year.

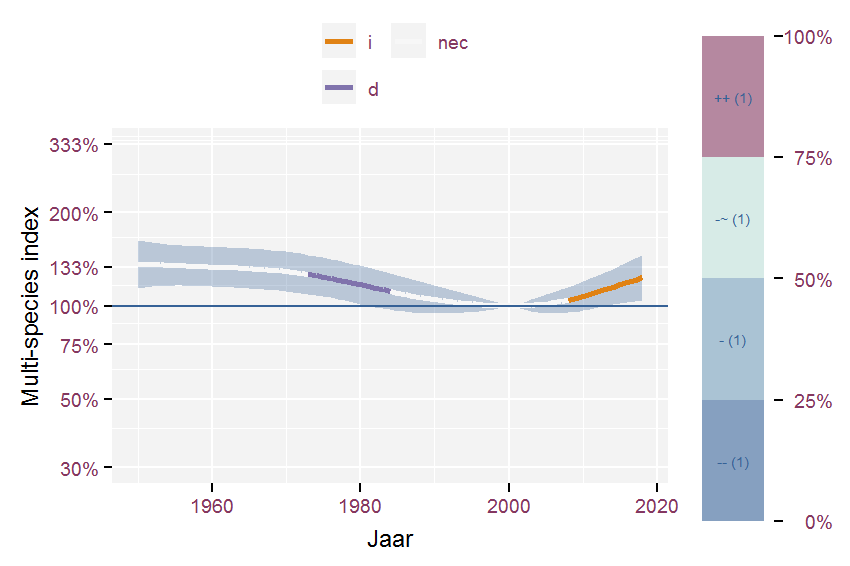
Figure 3.31: Multi-species index for species belonging to Socio-ecological groups (Stieperaere & Franssen 1982) dry heathland on nutrient poor soils and period 1950-2018. The index uses 2000 as baseline year.

Table 3.29: Corresponding list of species for Socio-ecological groups (Stieperaere & Franssen 1982) dry heathland on nutrient poor soils together with their effect classification for the final year compared to 1950.
Multi-species index for species groups belonging to Socio-ecological groups (Stieperaere & Franssen 1982) dry heathland on nutrient poor soils and period 1990-2018. The index uses 2000 as baseline year.

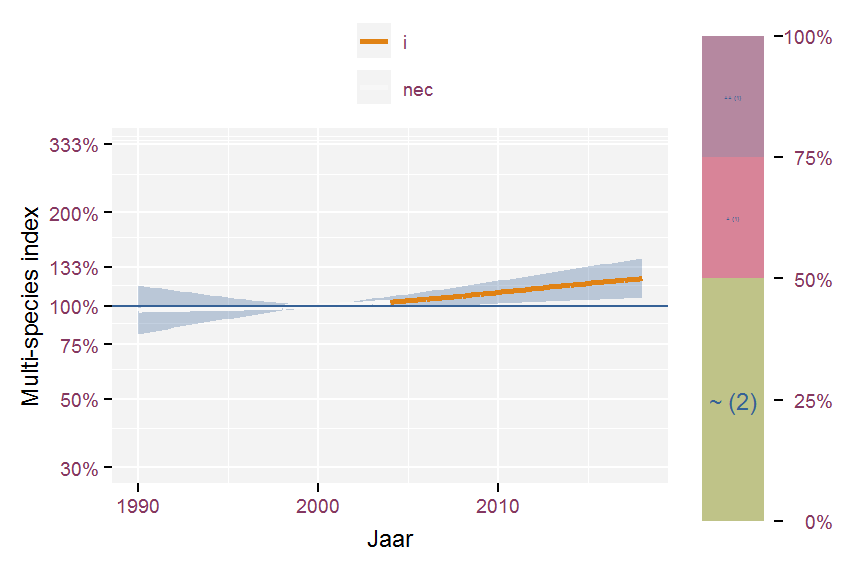
Figure 3.32: Multi-species index for species groups belonging to Socio-ecological groups (Stieperaere & Franssen 1982) dry heathland on nutrient poor soils and period 1990-2018. The index uses 2000 as baseline year.

Table 3.30: Corresponding list of species for Socio-ecological groups (Stieperaere & Franssen 1982) dry heathland on nutrient poor soils together with their effect classification for the final year compared to 1990.

3.3.7 forests on moderate nutrient poor, dry acid soils

Multi-species index for species belonging to Socio-ecological groups (Stieperaere & Franssen 1982) forests on moderate nutrient poor, dry acid soils and period 1950-2018. The index uses 2000 as baseline year.

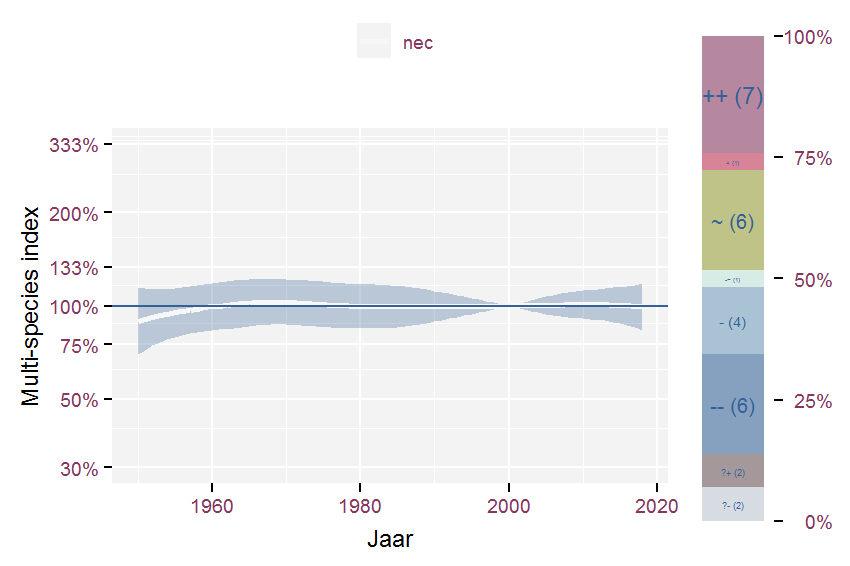
Figure 3.33: Multi-species index for species belonging to Socio-ecological groups (Stieperaere & Franssen 1982) forests on moderate nutrient poor, dry acid soils and period 1950-2018. The index uses 2000 as baseline year.

Table 3.31: Corresponding list of species for Socio-ecological groups (Stieperaere & Franssen 1982) forests on moderate nutrient poor, dry acid soils together with their effect classification for the final year compared to 1950.
Multi-species index for species groups belonging to Socio-ecological groups (Stieperaere & Franssen 1982) forests on moderate nutrient poor, dry acid soils and period 1990-2018. The index uses 2000 as baseline year.

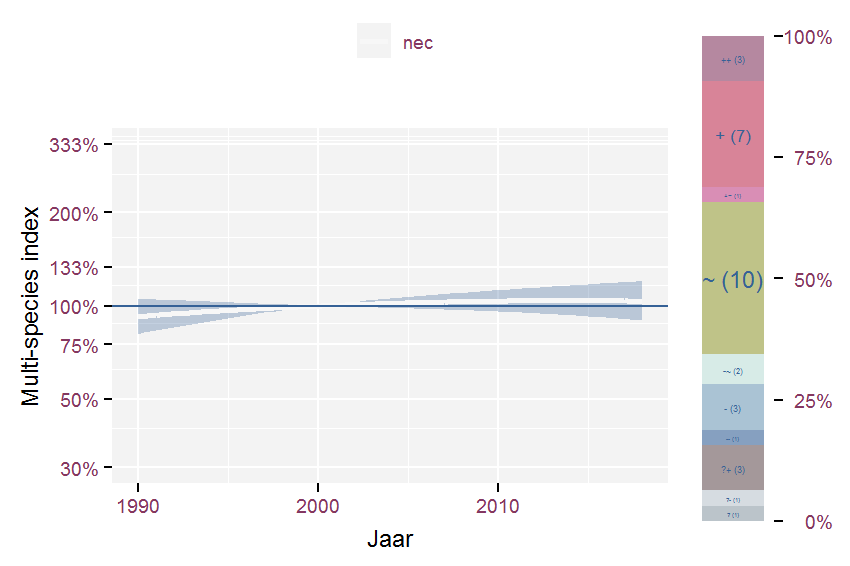
Figure 3.34: Multi-species index for species groups belonging to Socio-ecological groups (Stieperaere & Franssen 1982) forests on moderate nutrient poor, dry acid soils and period 1990-2018. The index uses 2000 as baseline year.

Table 3.32: Corresponding list of species for Socio-ecological groups (Stieperaere & Franssen 1982) forests on moderate nutrient poor, dry acid soils together with their effect classification for the final year compared to 1990.

3.3.8 forests on moderate nutrient rich, moist to wet soils and headwaters

Multi-species index for species belonging to Socio-ecological groups (Stieperaere & Franssen 1982) forests on moderate nutrient rich, moist to wet soils and headwaters and period 1950-2018. The index uses 2000 as baseline year.

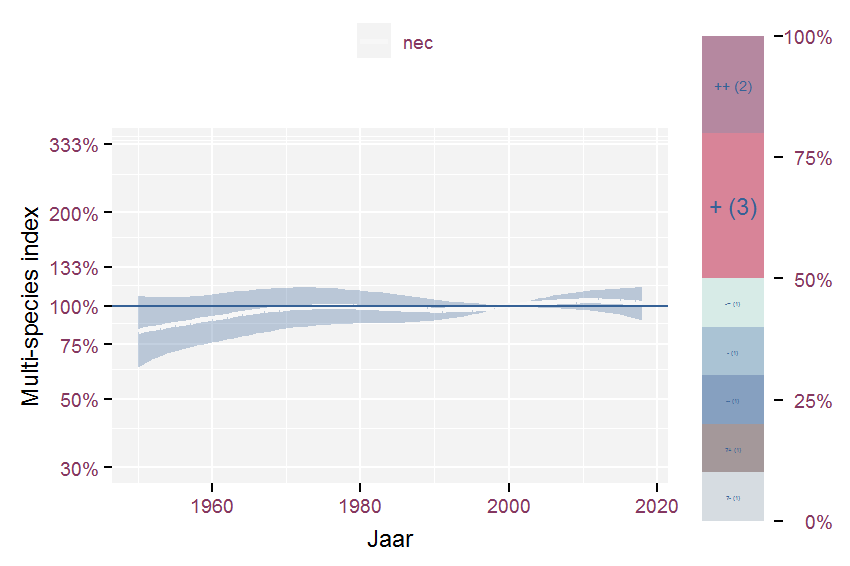
Figure 3.35: Multi-species index for species belonging to Socio-ecological groups (Stieperaere & Franssen 1982) forests on moderate nutrient rich, moist to wet soils and headwaters and period 1950-2018. The index uses 2000 as baseline year.

Table 3.33: Corresponding list of species for Socio-ecological groups (Stieperaere & Franssen 1982) forests on moderate nutrient rich, moist to wet soils and headwaters together with their effect classification for the final year compared to 1950.
Multi-species index for species groups belonging to Socio-ecological groups (Stieperaere & Franssen 1982) forests on moderate nutrient rich, moist to wet soils and headwaters and period 1990-2018. The index uses 2000 as baseline year.

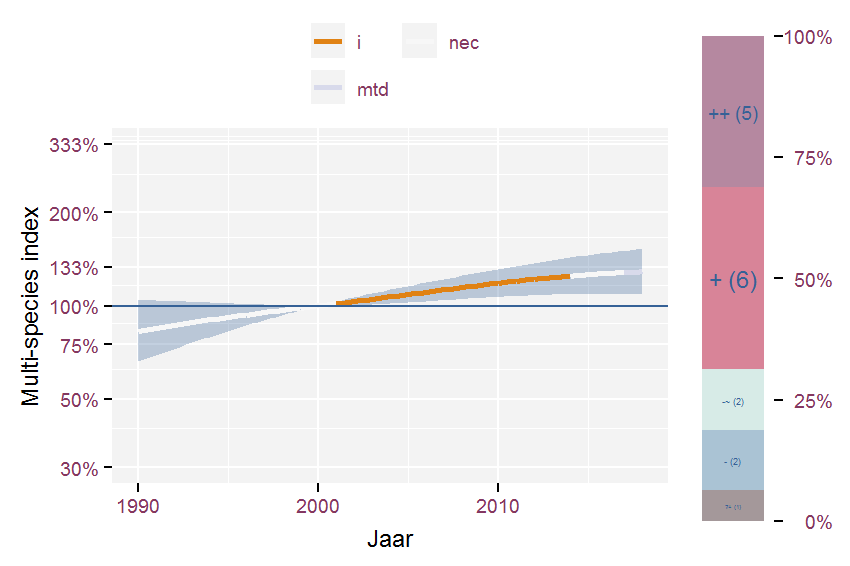
Figure 3.36: Multi-species index for species groups belonging to Socio-ecological groups (Stieperaere & Franssen 1982) forests on moderate nutrient rich, moist to wet soils and headwaters and period 1990-2018. The index uses 2000 as baseline year.

Table 3.34: Corresponding list of species for Socio-ecological groups (Stieperaere & Franssen 1982) forests on moderate nutrient rich, moist to wet soils and headwaters together with their effect classification for the final year compared to 1990.

3.3.9 forests on moist soils, moderate rich in nutrients

Multi-species index for species belonging to Socio-ecological groups (Stieperaere & Franssen 1982) forests on moist soils, moderate rich in nutrients and period 1950-2018. The index uses 2000 as baseline year.

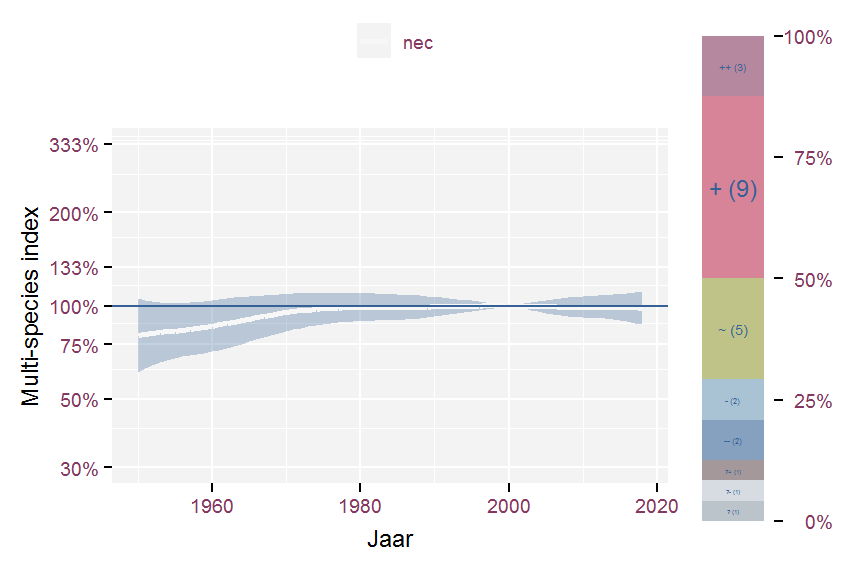
Figure 3.37: Multi-species index for species belonging to Socio-ecological groups (Stieperaere & Franssen 1982) forests on moist soils, moderate rich in nutrients and period 1950-2018. The index uses 2000 as baseline year.

Table 3.35: Corresponding list of species for Socio-ecological groups (Stieperaere & Franssen 1982) forests on moist soils, moderate rich in nutrients together with their effect classification for the final year compared to 1950.
Multi-species index for species groups belonging to Socio-ecological groups (Stieperaere & Franssen 1982) forests on moist soils, moderate rich in nutrients and period 1990-2018. The index uses 2000 as baseline year.

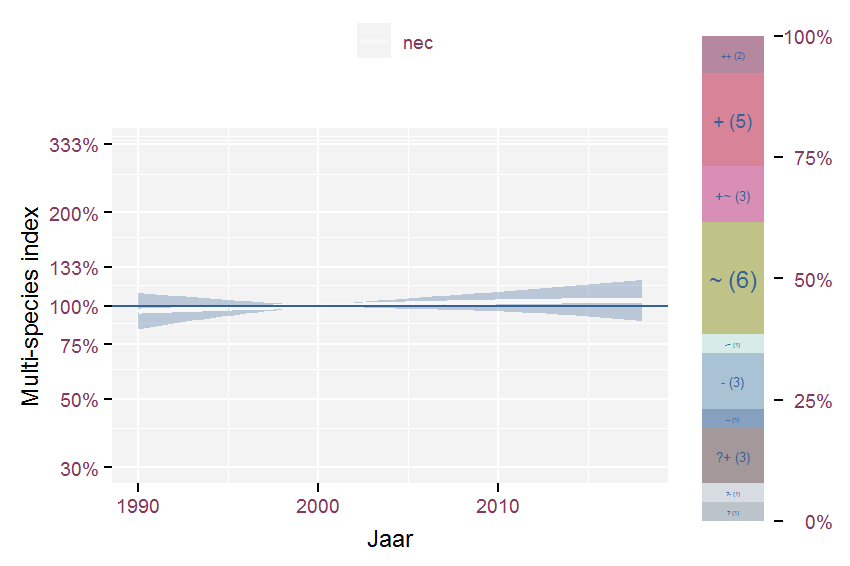
Figure 3.38: Multi-species index for species groups belonging to Socio-ecological groups (Stieperaere & Franssen 1982) forests on moist soils, moderate rich in nutrients and period 1990-2018. The index uses 2000 as baseline year.

Table 3.36: Corresponding list of species for Socio-ecological groups (Stieperaere & Franssen 1982) forests on moist soils, moderate rich in nutrients together with their effect classification for the final year compared to 1990.

3.3.10 forests on old, weakly acidic, neutral to slightly basic soils

Multi-species index for species belonging to Socio-ecological groups (Stieperaere & Franssen 1982) forests on old, weakly acidic, neutral to slightly basic soils and period 1950-2018. The index uses 2000 as baseline year.

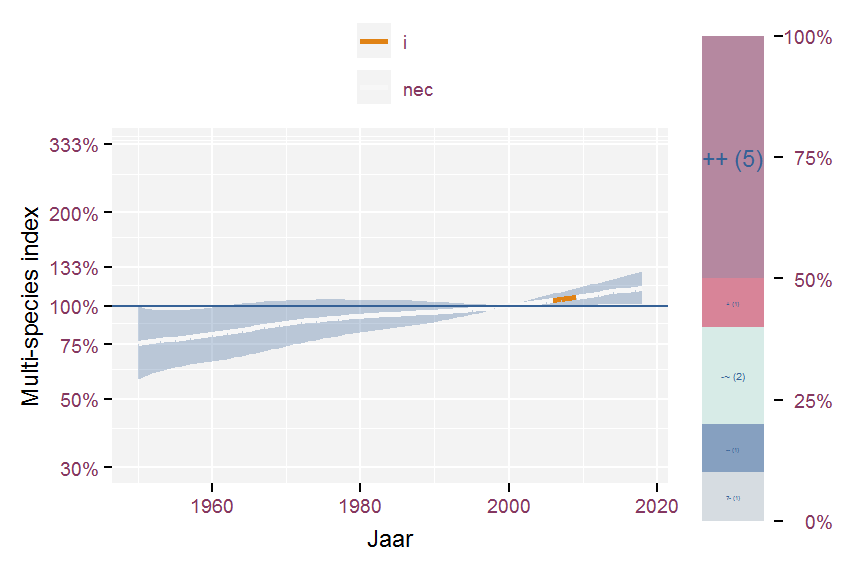
Figure 3.39: Multi-species index for species belonging to Socio-ecological groups (Stieperaere & Franssen 1982) forests on old, weakly acidic, neutral to slightly basic soils and period 1950-2018. The index uses 2000 as baseline year.

Table 3.37: Corresponding list of species for Socio-ecological groups (Stieperaere & Franssen 1982) forests on old, weakly acidic, neutral to slightly basic soils together with their effect classification for the final year compared to 1950.
Multi-species index for species groups belonging to Socio-ecological groups (Stieperaere & Franssen 1982) forests on old, weakly acidic, neutral to slightly basic soils and period 1990-2018. The index uses 2000 as baseline year.

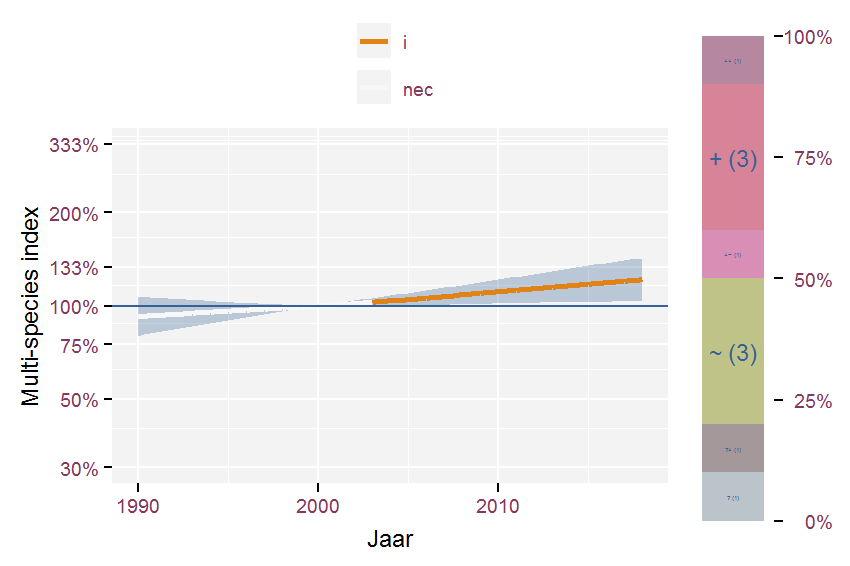
Figure 3.40: Multi-species index for species groups belonging to Socio-ecological groups (Stieperaere & Franssen 1982) forests on old, weakly acidic, neutral to slightly basic soils and period 1990-2018. The index uses 2000 as baseline year.

Table 3.38: Corresponding list of species for Socio-ecological groups (Stieperaere & Franssen 1982) forests on old, weakly acidic, neutral to slightly basic soils together with their effect classification for the final year compared to 1990.

3.3.11 forests on young, unstable moist and stony soils (ravines)

Multi-species index for species belonging to Socio-ecological groups (Stieperaere & Franssen 1982) forests on young, unstable moist and stony soils (ravines) and period 1950-2018. The index uses 2000 as baseline year.

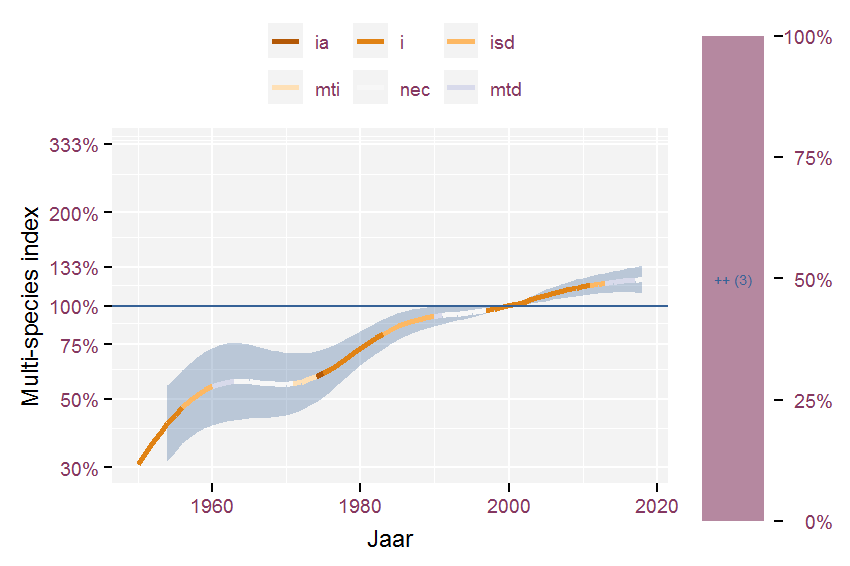
Figure 3.41: Multi-species index for species belonging to Socio-ecological groups (Stieperaere & Franssen 1982) forests on young, unstable moist and stony soils (ravines) and period 1950-2018. The index uses 2000 as baseline year.

Table 3.39: Corresponding list of species for Socio-ecological groups (Stieperaere & Franssen 1982) forests on young, unstable moist and stony soils (ravines) together with their effect classification for the final year compared to 1950.
Multi-species index for species groups belonging to Socio-ecological groups (Stieperaere & Franssen 1982) forests on young, unstable moist and stony soils (ravines) and period 1990-2018. The index uses 2000 as baseline year.

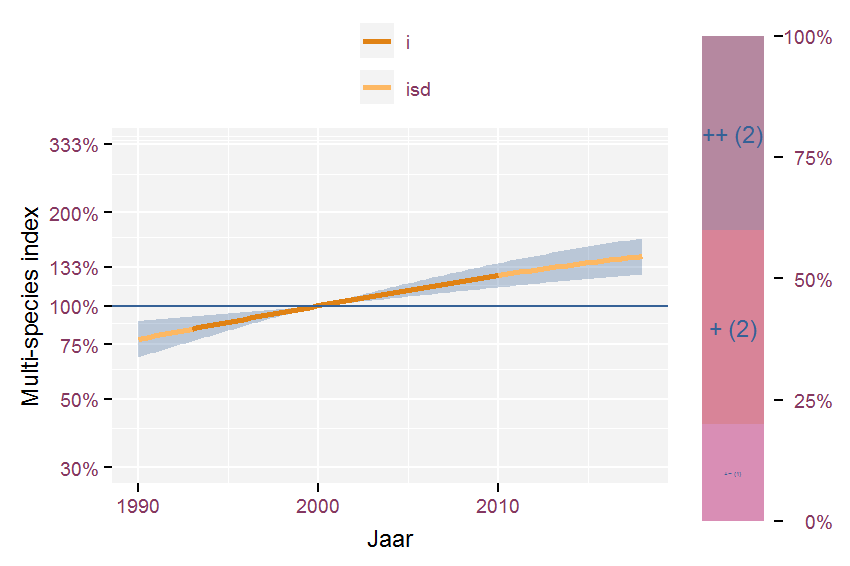
Figure 3.42: Multi-species index for species groups belonging to Socio-ecological groups (Stieperaere & Franssen 1982) forests on young, unstable moist and stony soils (ravines) and period 1990-2018. The index uses 2000 as baseline year.

Table 3.40: Corresponding list of species for Socio-ecological groups (Stieperaere & Franssen 1982) forests on young, unstable moist and stony soils (ravines) together with their effect classification for the final year compared to 1990.

3.3.12 fresh to weakly brackish, (weakly) nutrient rich waters (mostly obligate aquatic plants)

Multi-species index for species belonging to Socio-ecological groups (Stieperaere & Franssen 1982) fresh to weakly brackish, (weakly) nutrient rich waters (mostly obligate aquatic plants) and period 1950-2018. The index uses 2000 as baseline year.

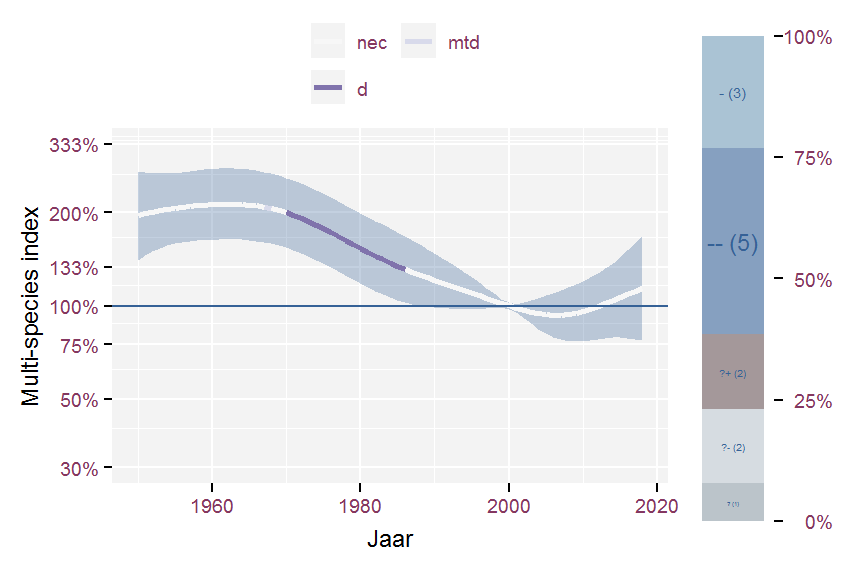
Figure 3.43: Multi-species index for species belonging to Socio-ecological groups (Stieperaere & Franssen 1982) fresh to weakly brackish, (weakly) nutrient rich waters (mostly obligate aquatic plants) and period 1950-2018. The index uses 2000 as baseline year.

Table 3.41: Corresponding list of species for Socio-ecological groups (Stieperaere & Franssen 1982) fresh to weakly brackish, (weakly) nutrient rich waters (mostly obligate aquatic plants) together with their effect classification for the final year compared to 1950.
Multi-species index for species groups belonging to Socio-ecological groups (Stieperaere & Franssen 1982) fresh to weakly brackish, (weakly) nutrient rich waters (mostly obligate aquatic plants) and period 1990-2018. The index uses 2000 as baseline year.

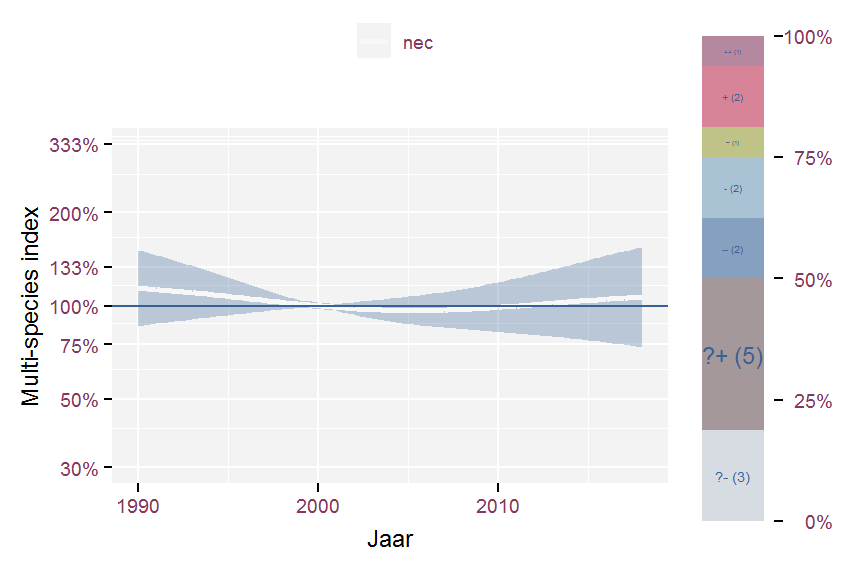
Figure 3.44: Multi-species index for species groups belonging to Socio-ecological groups (Stieperaere & Franssen 1982) fresh to weakly brackish, (weakly) nutrient rich waters (mostly obligate aquatic plants) and period 1990-2018. The index uses 2000 as baseline year.

Table 3.42: Corresponding list of species for Socio-ecological groups (Stieperaere & Franssen 1982) fresh to weakly brackish, (weakly) nutrient rich waters (mostly obligate aquatic plants) together with their effect classification for the final year compared to 1990.

3.3.13 grasslands on dry, acidic, nutrient poor soils

Multi-species index for species belonging to Socio-ecological groups (Stieperaere & Franssen 1982) grasslands on dry, acidic, nutrient poor soils and period 1950-2018. The index uses 2000 as baseline year.

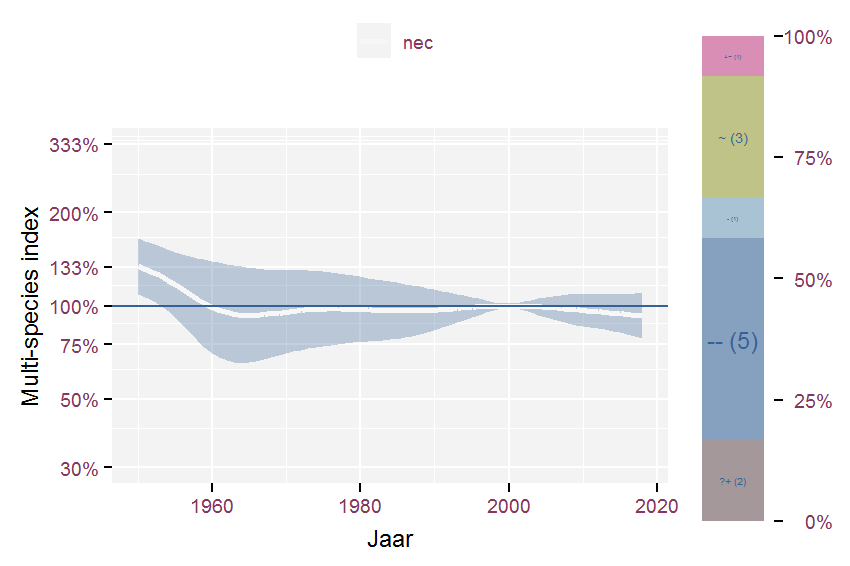
Figure 3.45: Multi-species index for species belonging to Socio-ecological groups (Stieperaere & Franssen 1982) grasslands on dry, acidic, nutrient poor soils and period 1950-2018. The index uses 2000 as baseline year.

Table 3.43: Corresponding list of species for Socio-ecological groups (Stieperaere & Franssen 1982) grasslands on dry, acidic, nutrient poor soils together with their effect classification for the final year compared to 1950.
Multi-species index for species groups belonging to Socio-ecological groups (Stieperaere & Franssen 1982) grasslands on dry, acidic, nutrient poor soils and period 1990-2018. The index uses 2000 as baseline year.

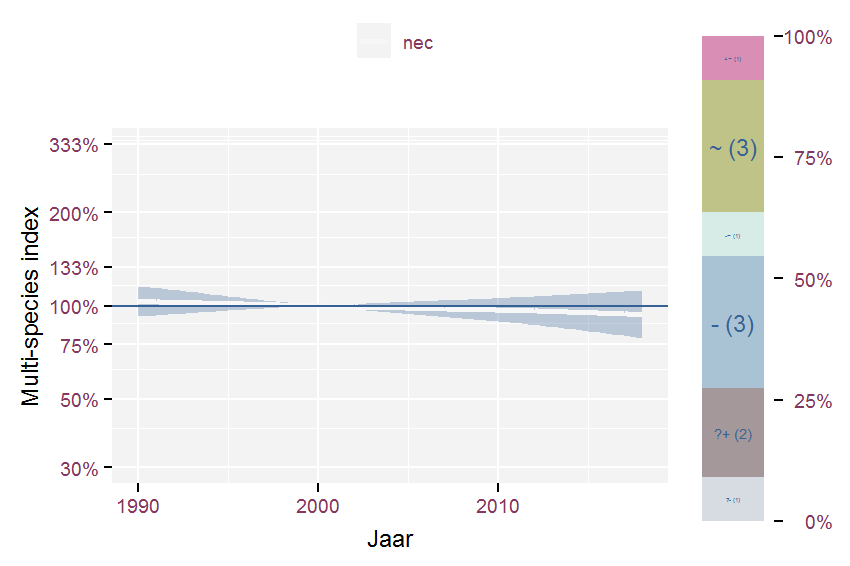
Figure 3.46: Multi-species index for species groups belonging to Socio-ecological groups (Stieperaere & Franssen 1982) grasslands on dry, acidic, nutrient poor soils and period 1990-2018. The index uses 2000 as baseline year.

Table 3.44: Corresponding list of species for Socio-ecological groups (Stieperaere & Franssen 1982) grasslands on dry, acidic, nutrient poor soils together with their effect classification for the final year compared to 1990.

3.3.14 grasslands on dry, neutral soils, moderate rich in nutrients

Multi-species index for species belonging to Socio-ecological groups (Stieperaere & Franssen 1982) grasslands on dry, neutral soils, moderate rich in nutrients and period 1950-2018. The index uses 2000 as baseline year.

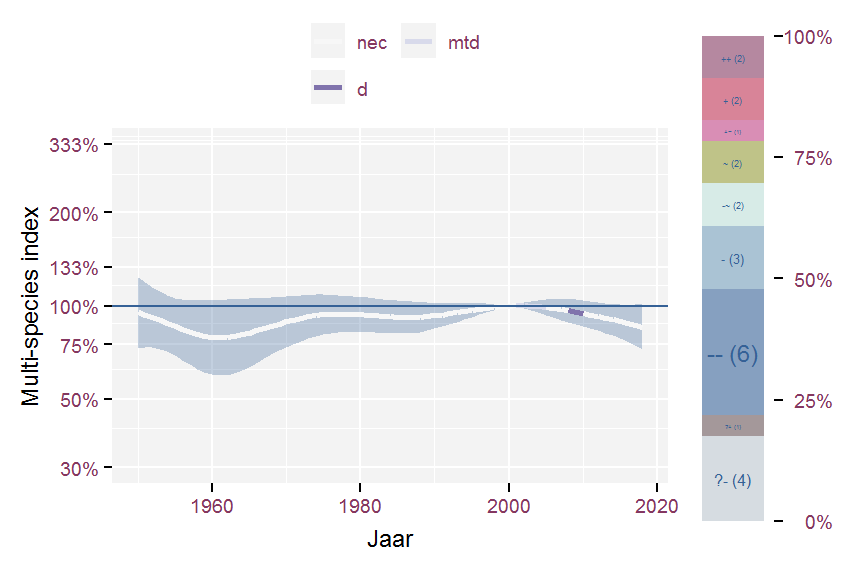
Figure 3.47: Multi-species index for species belonging to Socio-ecological groups (Stieperaere & Franssen 1982) grasslands on dry, neutral soils, moderate rich in nutrients and period 1950-2018. The index uses 2000 as baseline year.

Table 3.45: Corresponding list of species for Socio-ecological groups (Stieperaere & Franssen 1982) grasslands on dry, neutral soils, moderate rich in nutrients together with their effect classification for the final year compared to 1950.
Multi-species index for species groups belonging to Socio-ecological groups (Stieperaere & Franssen 1982) grasslands on dry, neutral soils, moderate rich in nutrients and period 1990-2018. The index uses 2000 as baseline year.

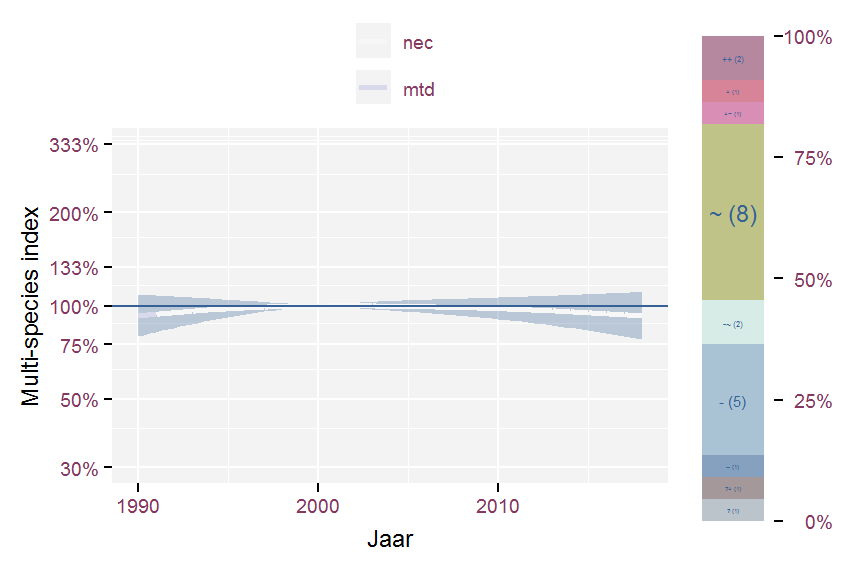
Figure 3.48: Multi-species index for species groups belonging to Socio-ecological groups (Stieperaere & Franssen 1982) grasslands on dry, neutral soils, moderate rich in nutrients and period 1990-2018. The index uses 2000 as baseline year.

Table 3.46: Corresponding list of species for Socio-ecological groups (Stieperaere & Franssen 1982) grasslands on dry, neutral soils, moderate rich in nutrients together with their effect classification for the final year compared to 1990.

3.3.15 grasslands on dry, nutrient poor, calcareous soils or neutral tot basic soils

Multi-species index for species belonging to Socio-ecological groups (Stieperaere & Franssen 1982) grasslands on dry, nutrient poor, calcareous soils or neutral tot basic soils and period 1950-2018. The index uses 2000 as baseline year.

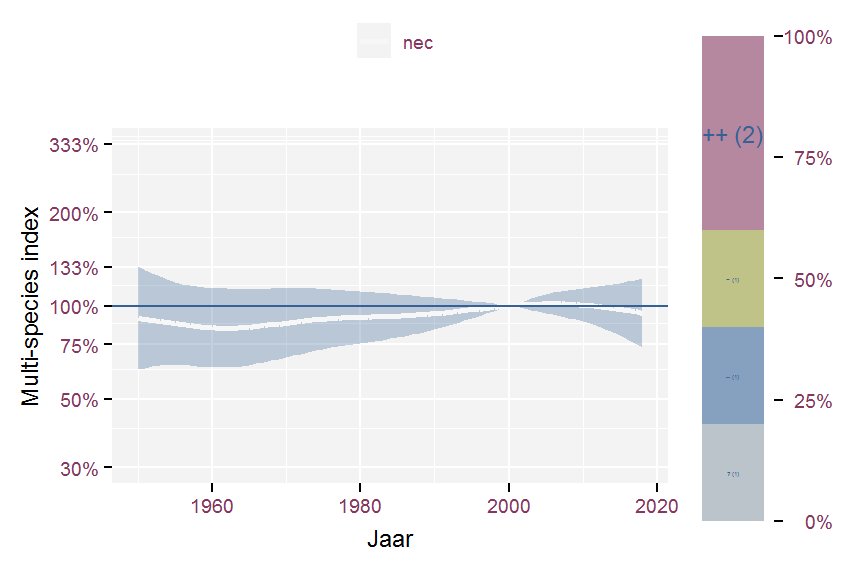
Figure 3.49: Multi-species index for species belonging to Socio-ecological groups (Stieperaere & Franssen 1982) grasslands on dry, nutrient poor, calcareous soils or neutral tot basic soils and period 1950-2018. The index uses 2000 as baseline year.

Table 3.47: Corresponding list of species for Socio-ecological groups (Stieperaere & Franssen 1982) grasslands on dry, nutrient poor, calcareous soils or neutral tot basic soils together with their effect classification for the final year compared to 1950.
Multi-species index for species groups belonging to Socio-ecological groups (Stieperaere & Franssen 1982) grasslands on dry, nutrient poor, calcareous soils or neutral tot basic soils and period 1990-2018. The index uses 2000 as baseline year.

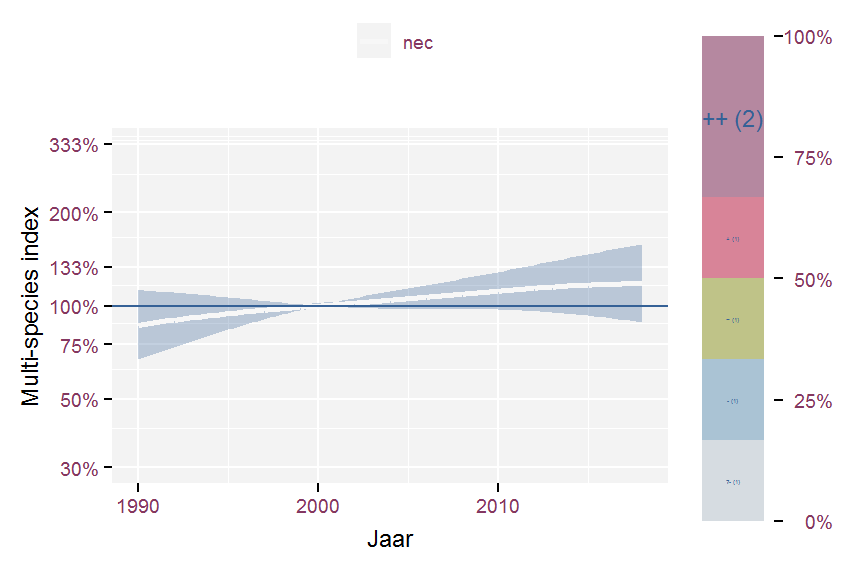
Figure 3.50: Multi-species index for species groups belonging to Socio-ecological groups (Stieperaere & Franssen 1982) grasslands on dry, nutrient poor, calcareous soils or neutral tot basic soils and period 1990-2018. The index uses 2000 as baseline year.

Table 3.48: Corresponding list of species for Socio-ecological groups (Stieperaere & Franssen 1982) grasslands on dry, nutrient poor, calcareous soils or neutral tot basic soils together with their effect classification for the final year compared to 1990.

3.3.16 marsh vegetation in fresh, nutrient-rich, flowing or periodically dry waters; not peat forming

Multi-species index for species belonging to Socio-ecological groups (Stieperaere & Franssen 1982) marsh vegetation in fresh, nutrient-rich, flowing or periodically dry waters; not peat forming and period 1950-2018. The index uses 2000 as baseline year.

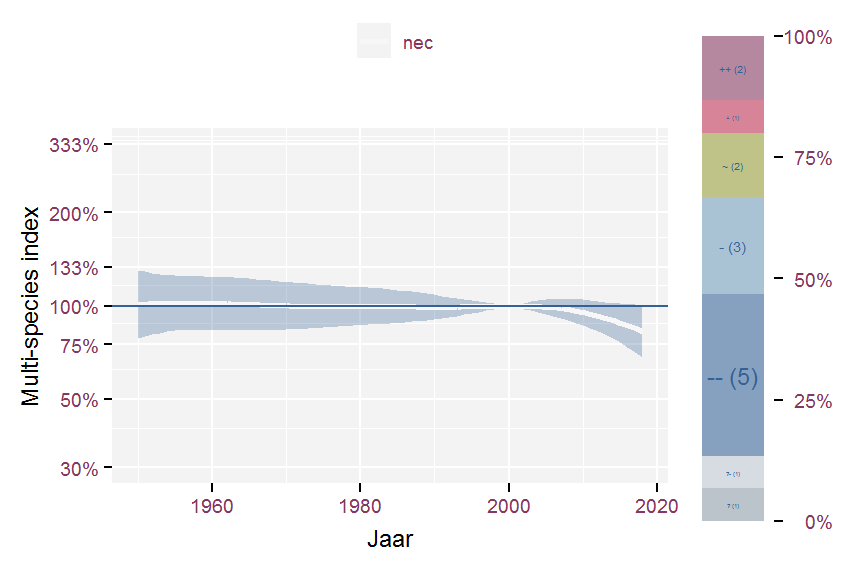
Figure 3.51: Multi-species index for species belonging to Socio-ecological groups (Stieperaere & Franssen 1982) marsh vegetation in fresh, nutrient-rich, flowing or periodically dry waters; not peat forming and period 1950-2018. The index uses 2000 as baseline year.

Table 3.49: Corresponding list of species for Socio-ecological groups (Stieperaere & Franssen 1982) marsh vegetation in fresh, nutrient-rich, flowing or periodically dry waters; not peat forming together with their effect classification for the final year compared to 1950.
Multi-species index for species groups belonging to Socio-ecological groups (Stieperaere & Franssen 1982) marsh vegetation in fresh, nutrient-rich, flowing or periodically dry waters; not peat forming and period 1990-2018. The index uses 2000 as baseline year.

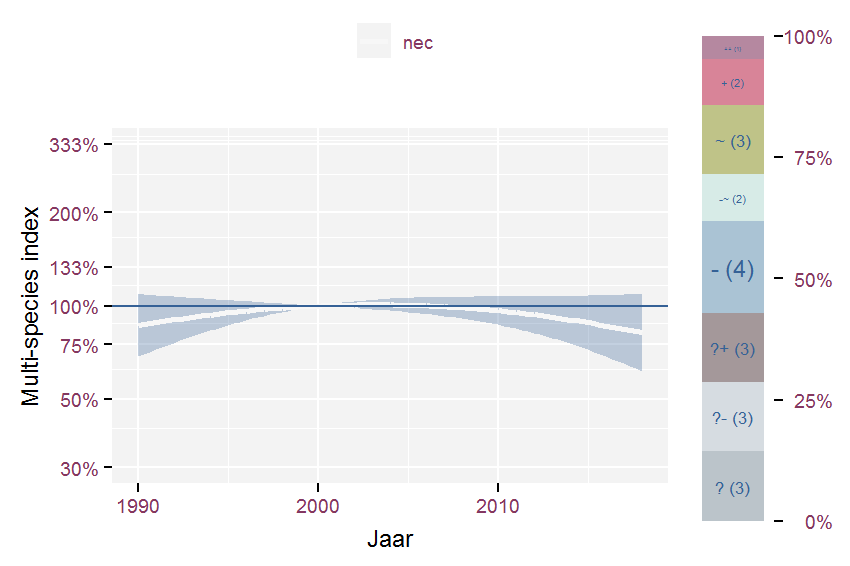
Figure 3.52: Multi-species index for species groups belonging to Socio-ecological groups (Stieperaere & Franssen 1982) marsh vegetation in fresh, nutrient-rich, flowing or periodically dry waters; not peat forming and period 1990-2018. The index uses 2000 as baseline year.

Table 3.50: Corresponding list of species for Socio-ecological groups (Stieperaere & Franssen 1982) marsh vegetation in fresh, nutrient-rich, flowing or periodically dry waters; not peat forming together with their effect classification for the final year compared to 1990.

3.3.17 marsh vegetation in fresh, nutrient-rich, stagnant or light-flowing shallow to deep waters; often peat forming

Multi-species index for species belonging to Socio-ecological groups (Stieperaere & Franssen 1982) marsh vegetation in fresh, nutrient-rich, stagnant or light-flowing shallow to deep waters; often peat forming and period 1950-2018. The index uses 2000 as baseline year.

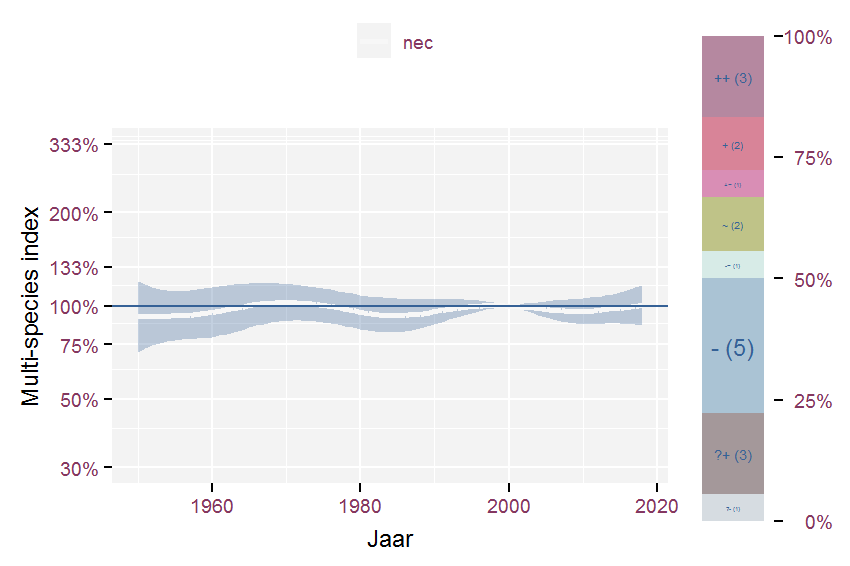
Figure 3.53: Multi-species index for species belonging to Socio-ecological groups (Stieperaere & Franssen 1982) marsh vegetation in fresh, nutrient-rich, stagnant or light-flowing shallow to deep waters; often peat forming and period 1950-2018. The index uses 2000 as baseline year.

Table 3.51: Corresponding list of species for Socio-ecological groups (Stieperaere & Franssen 1982) marsh vegetation in fresh, nutrient-rich, stagnant or light-flowing shallow to deep waters; often peat forming together with their effect classification for the final year compared to 1950.
Multi-species index for species groups belonging to Socio-ecological groups (Stieperaere & Franssen 1982) marsh vegetation in fresh, nutrient-rich, stagnant or light-flowing shallow to deep waters; often peat forming and period 1990-2018. The index uses 2000 as baseline year.

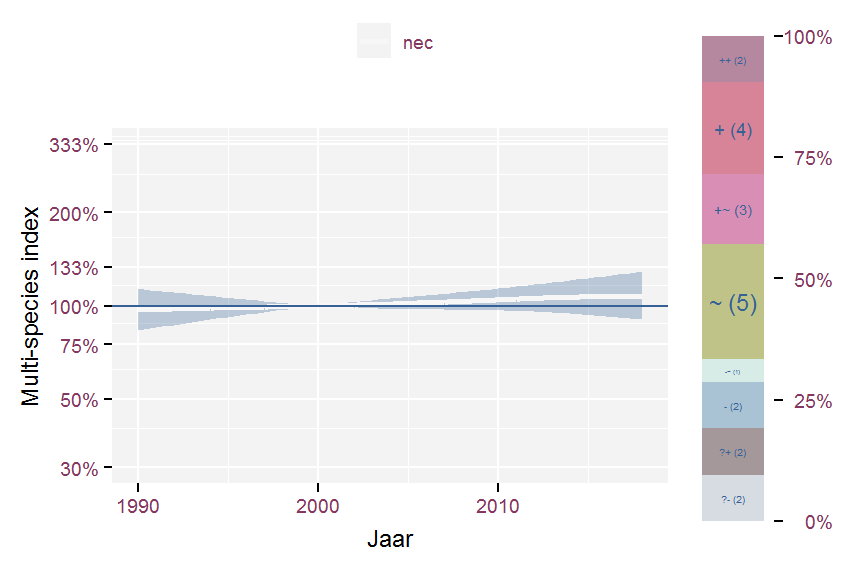
Figure 3.54: Multi-species index for species groups belonging to Socio-ecological groups (Stieperaere & Franssen 1982) marsh vegetation in fresh, nutrient-rich, stagnant or light-flowing shallow to deep waters; often peat forming and period 1990-2018. The index uses 2000 as baseline year.

Table 3.52: Corresponding list of species for Socio-ecological groups (Stieperaere & Franssen 1982) marsh vegetation in fresh, nutrient-rich, stagnant or light-flowing shallow to deep waters; often peat forming together with their effect classification for the final year compared to 1990.

3.3.18 moderately fertilized grasslands on (moderately) moist soil

Multi-species index for species belonging to Socio-ecological groups (Stieperaere & Franssen 1982) moderately fertilized grasslands on (moderately) moist soil and period 1950-2018. The index uses 2000 as baseline year.

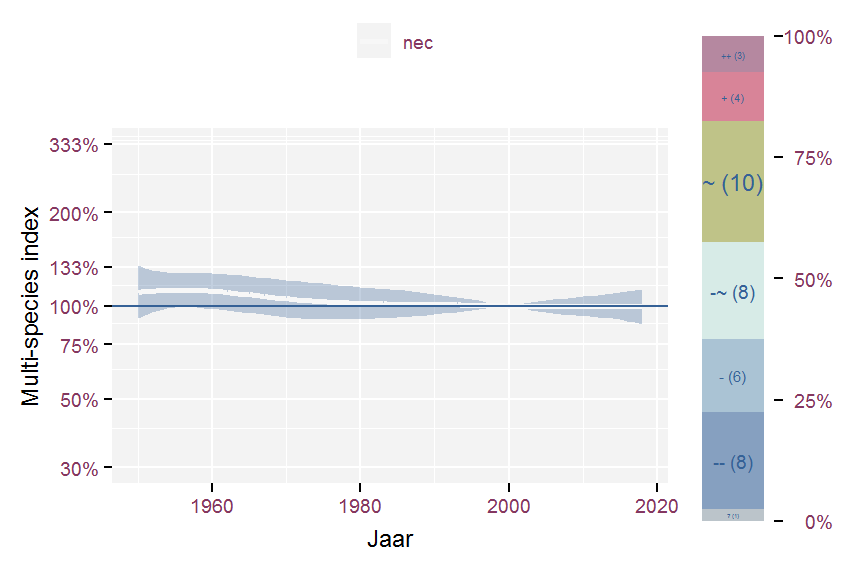
Figure 3.55: Multi-species index for species belonging to Socio-ecological groups (Stieperaere & Franssen 1982) moderately fertilized grasslands on (moderately) moist soil and period 1950-2018. The index uses 2000 as baseline year.

Table 3.53: Corresponding list of species for Socio-ecological groups (Stieperaere & Franssen 1982) moderately fertilized grasslands on (moderately) moist soil together with their effect classification for the final year compared to 1950.
Multi-species index for species groups belonging to Socio-ecological groups (Stieperaere & Franssen 1982) moderately fertilized grasslands on (moderately) moist soil and period 1990-2018. The index uses 2000 as baseline year.

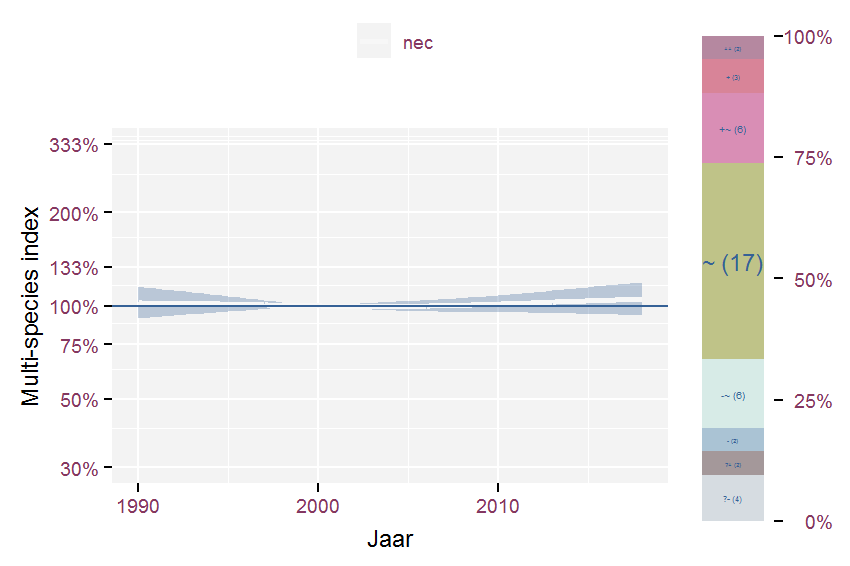
Figure 3.56: Multi-species index for species groups belonging to Socio-ecological groups (Stieperaere & Franssen 1982) moderately fertilized grasslands on (moderately) moist soil and period 1990-2018. The index uses 2000 as baseline year.

Table 3.54: Corresponding list of species for Socio-ecological groups (Stieperaere & Franssen 1982) moderately fertilized grasslands on (moderately) moist soil together with their effect classification for the final year compared to 1990.

3.3.19 moderately fertilized grasslands on wet soil

Multi-species index for species belonging to Socio-ecological groups (Stieperaere & Franssen 1982) moderately fertilized grasslands on wet soil and period 1950-2018. The index uses 2000 as baseline year.

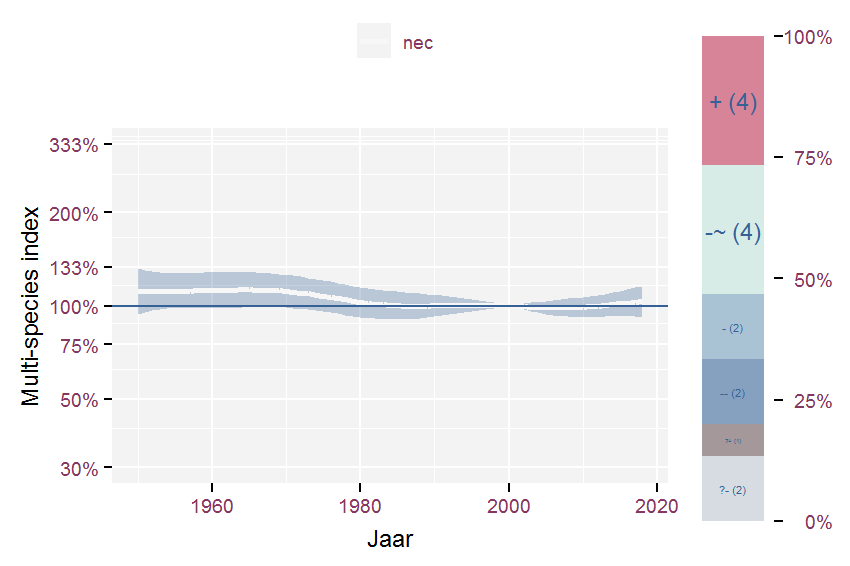
Figure 3.57: Multi-species index for species belonging to Socio-ecological groups (Stieperaere & Franssen 1982) moderately fertilized grasslands on wet soil and period 1950-2018. The index uses 2000 as baseline year.

Table 3.55: Corresponding list of species for Socio-ecological groups (Stieperaere & Franssen 1982) moderately fertilized grasslands on wet soil together with their effect classification for the final year compared to 1950.
Multi-species index for species groups belonging to Socio-ecological groups (Stieperaere & Franssen 1982) moderately fertilized grasslands on wet soil and period 1990-2018. The index uses 2000 as baseline year.

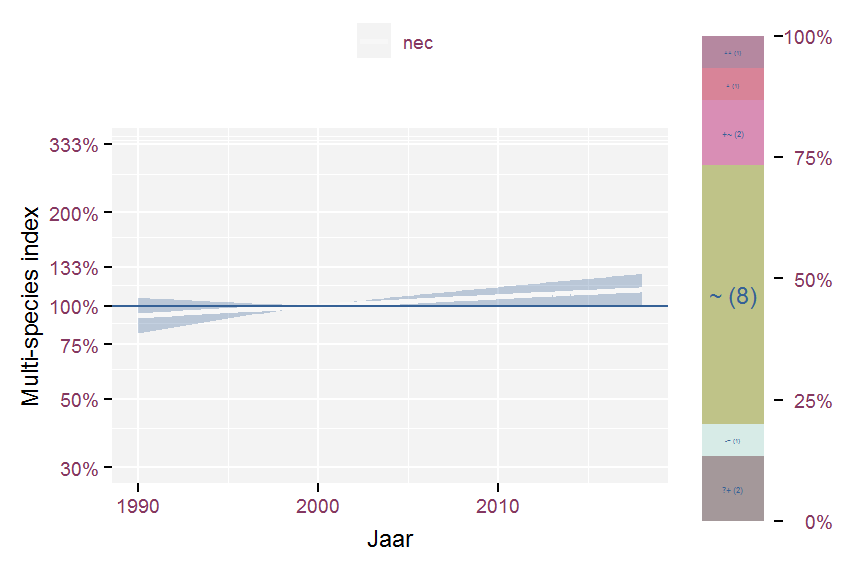
Figure 3.58: Multi-species index for species groups belonging to Socio-ecological groups (Stieperaere & Franssen 1982) moderately fertilized grasslands on wet soil and period 1990-2018. The index uses 2000 as baseline year.

Table 3.56: Corresponding list of species for Socio-ecological groups (Stieperaere & Franssen 1982) moderately fertilized grasslands on wet soil together with their effect classification for the final year compared to 1990.

3.3.20 moderately nutrient-poor, lime-poor, acidic peat bogs

Multi-species index for species belonging to Socio-ecological groups (Stieperaere & Franssen 1982) moderately nutrient-poor, lime-poor, acidic peat bogs and period 1950-2018. The index uses 2000 as baseline year.

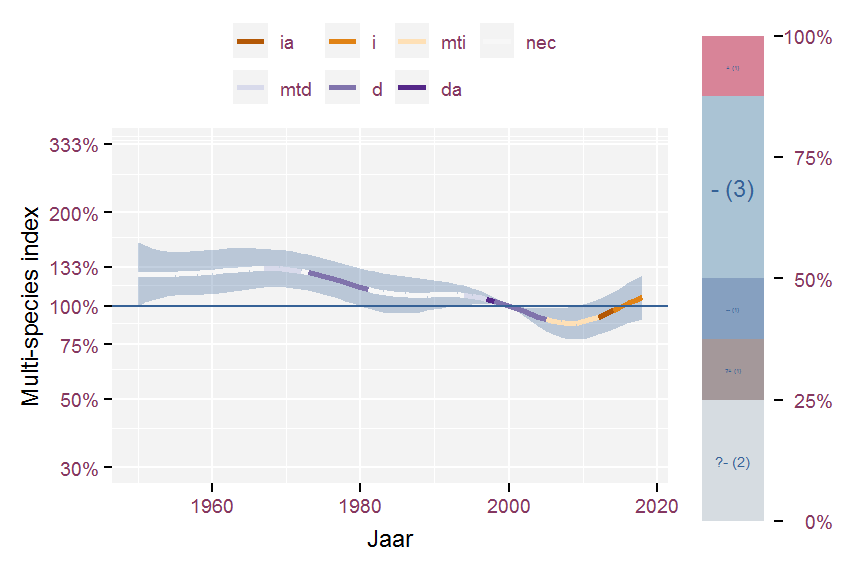
Figure 3.59: Multi-species index for species belonging to Socio-ecological groups (Stieperaere & Franssen 1982) moderately nutrient-poor, lime-poor, acidic peat bogs and period 1950-2018. The index uses 2000 as baseline year.

Table 3.57: Corresponding list of species for Socio-ecological groups (Stieperaere & Franssen 1982) moderately nutrient-poor, lime-poor, acidic peat bogs together with their effect classification for the final year compared to 1950.
Multi-species index for species groups belonging to Socio-ecological groups (Stieperaere & Franssen 1982) moderately nutrient-poor, lime-poor, acidic peat bogs and period 1990-2018. The index uses 2000 as baseline year.

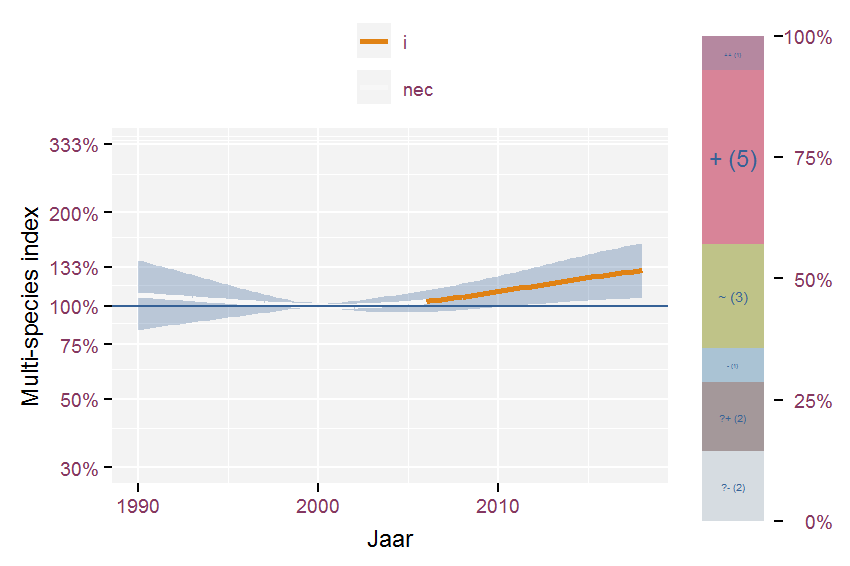
Figure 3.60: Multi-species index for species groups belonging to Socio-ecological groups (Stieperaere & Franssen 1982) moderately nutrient-poor, lime-poor, acidic peat bogs and period 1990-2018. The index uses 2000 as baseline year.

Table 3.58: Corresponding list of species for Socio-ecological groups (Stieperaere & Franssen 1982) moderately nutrient-poor, lime-poor, acidic peat bogs together with their effect classification for the final year compared to 1990.

3.3.21 pioneer vegetation on open, nutrient (especially nitrogen) rich, wet soil

Multi-species index for species belonging to Socio-ecological groups (Stieperaere & Franssen 1982) pioneer vegetation on open, nutrient (especially nitrogen) rich, wet soil and period 1950-2018. The index uses 2000 as baseline year.

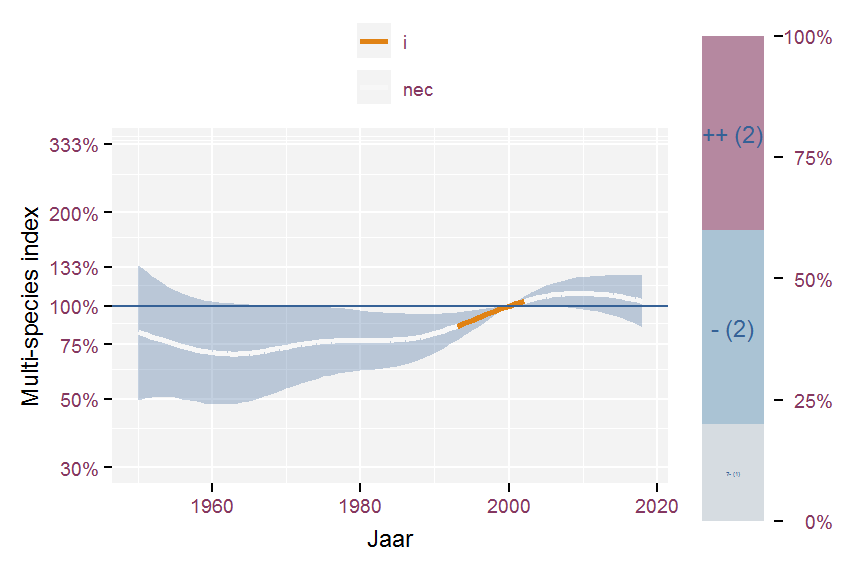
Figure 3.61: Multi-species index for species belonging to Socio-ecological groups (Stieperaere & Franssen 1982) pioneer vegetation on open, nutrient (especially nitrogen) rich, wet soil and period 1950-2018. The index uses 2000 as baseline year.

Table 3.59: Corresponding list of species for Socio-ecological groups (Stieperaere & Franssen 1982) pioneer vegetation on open, nutrient (especially nitrogen) rich, wet soil together with their effect classification for the final year compared to 1950.
Multi-species index for species groups belonging to Socio-ecological groups (Stieperaere & Franssen 1982) pioneer vegetation on open, nutrient (especially nitrogen) rich, wet soil and period 1990-2018. The index uses 2000 as baseline year.

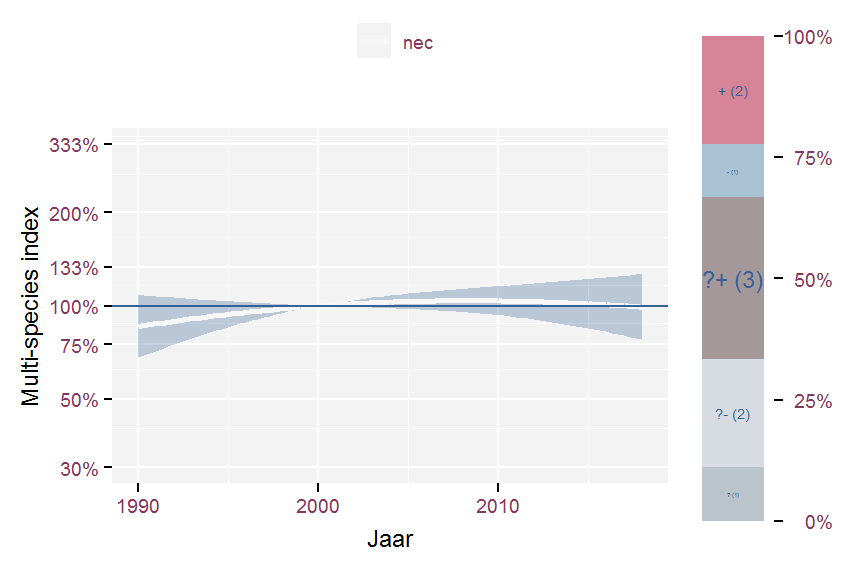
Figure 3.62: Multi-species index for species groups belonging to Socio-ecological groups (Stieperaere & Franssen 1982) pioneer vegetation on open, nutrient (especially nitrogen) rich, wet soil and period 1990-2018. The index uses 2000 as baseline year.

Table 3.60: Corresponding list of species for Socio-ecological groups (Stieperaere & Franssen 1982) pioneer vegetation on open, nutrient (especially nitrogen) rich, wet soil together with their effect classification for the final year compared to 1990.

3.3.22 pioneer vegetation on relatively nutrient-rich places with varying water levels

Multi-species index for species belonging to Socio-ecological groups (Stieperaere & Franssen 1982) pioneer vegetation on relatively nutrient-rich places with varying water levels and period 1950-2018. The index uses 2000 as baseline year.

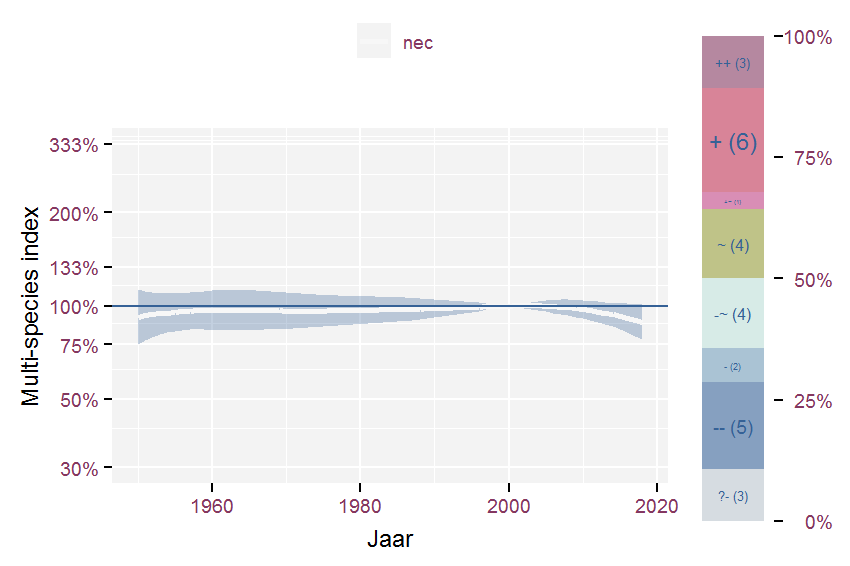
Figure 3.63: Multi-species index for species belonging to Socio-ecological groups (Stieperaere & Franssen 1982) pioneer vegetation on relatively nutrient-rich places with varying water levels and period 1950-2018. The index uses 2000 as baseline year.

Table 3.61: Corresponding list of species for Socio-ecological groups (Stieperaere & Franssen 1982) pioneer vegetation on relatively nutrient-rich places with varying water levels together with their effect classification for the final year compared to 1950.
Multi-species index for species groups belonging to Socio-ecological groups (Stieperaere & Franssen 1982) pioneer vegetation on relatively nutrient-rich places with varying water levels and period 1990-2018. The index uses 2000 as baseline year.

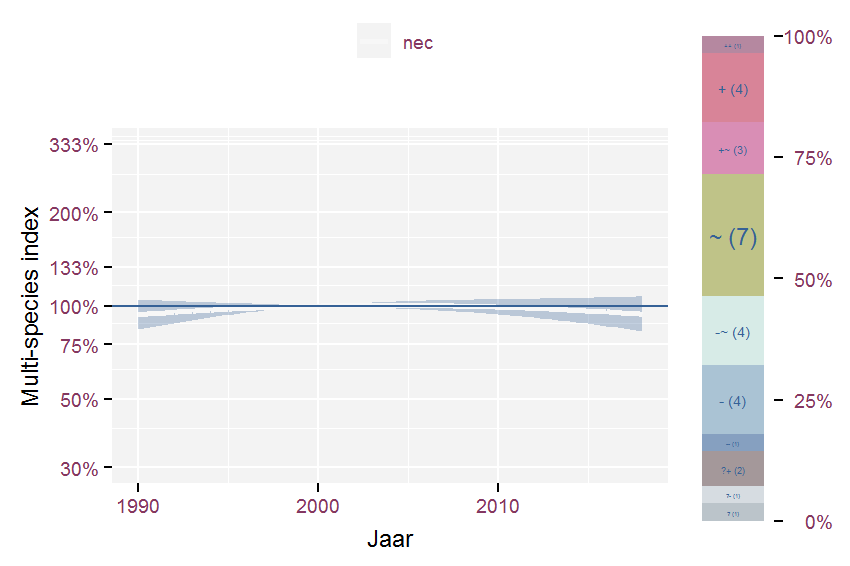
Figure 3.64: Multi-species index for species groups belonging to Socio-ecological groups (Stieperaere & Franssen 1982) pioneer vegetation on relatively nutrient-rich places with varying water levels and period 1990-2018. The index uses 2000 as baseline year.

Table 3.62: Corresponding list of species for Socio-ecological groups (Stieperaere & Franssen 1982) pioneer vegetation on relatively nutrient-rich places with varying water levels together with their effect classification for the final year compared to 1990.

3.3.23 raised bogs, wet heathlands and unfertilized grasslands on wet, very nutrient poor, peaty soils

Multi-species index for species belonging to Socio-ecological groups (Stieperaere & Franssen 1982) raised bogs, wet heathlands and unfertilized grasslands on wet, very nutrient poor, peaty soils and period 1950-2018. The index uses 2000 as baseline year.

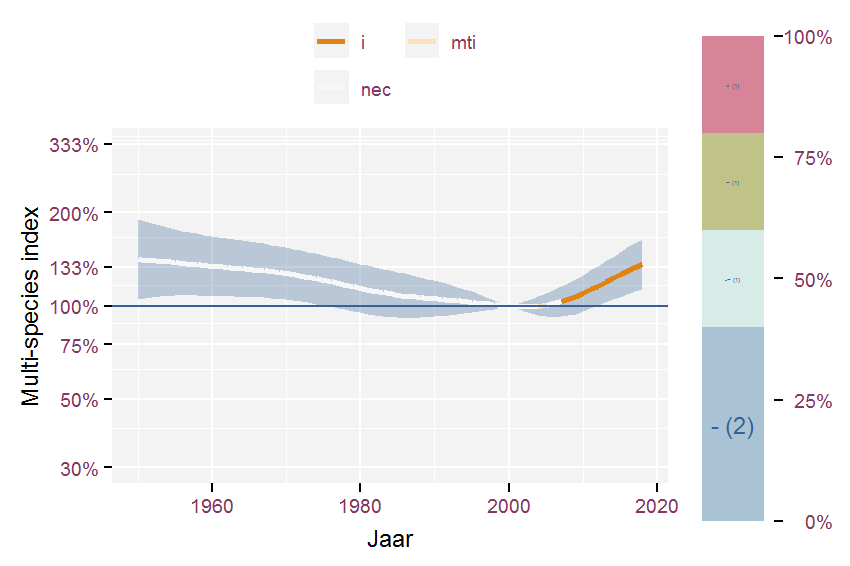
Figure 3.65: Multi-species index for species belonging to Socio-ecological groups (Stieperaere & Franssen 1982) raised bogs, wet heathlands and unfertilized grasslands on wet, very nutrient poor, peaty soils and period 1950-2018. The index uses 2000 as baseline year.

Table 3.63: Corresponding list of species for Socio-ecological groups (Stieperaere & Franssen 1982) raised bogs, wet heathlands and unfertilized grasslands on wet, very nutrient poor, peaty soils together with their effect classification for the final year compared to 1950.
Multi-species index for species groups belonging to Socio-ecological groups (Stieperaere & Franssen 1982) raised bogs, wet heathlands and unfertilized grasslands on wet, very nutrient poor, peaty soils and period 1990-2018. The index uses 2000 as baseline year.

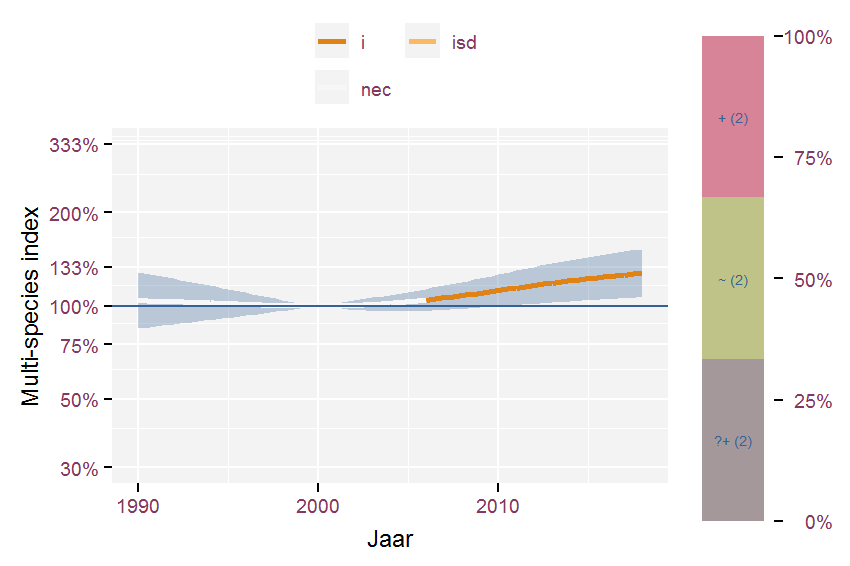
Figure 3.66: Multi-species index for species groups belonging to Socio-ecological groups (Stieperaere & Franssen 1982) raised bogs, wet heathlands and unfertilized grasslands on wet, very nutrient poor, peaty soils and period 1990-2018. The index uses 2000 as baseline year.

Table 3.64: Corresponding list of species for Socio-ecological groups (Stieperaere & Franssen 1982) raised bogs, wet heathlands and unfertilized grasslands on wet, very nutrient poor, peaty soils together with their effect classification for the final year compared to 1990.

3.3.24 regularly trampled pioneer vegetation on nutrient-rich soil

Multi-species index for species belonging to Socio-ecological groups (Stieperaere & Franssen 1982) regularly trampled pioneer vegetation on nutrient-rich soil and period 1950-2018. The index uses 2000 as baseline year.

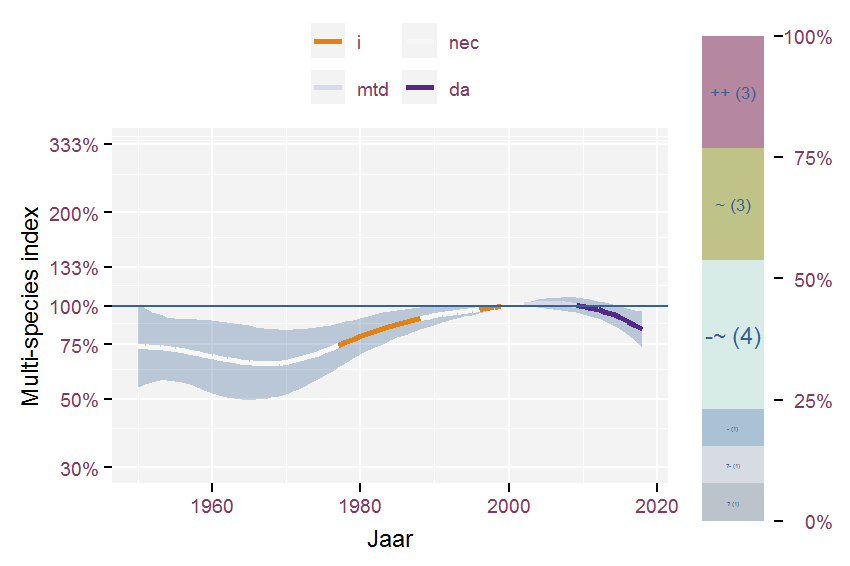
Figure 3.67: Multi-species index for species belonging to Socio-ecological groups (Stieperaere & Franssen 1982) regularly trampled pioneer vegetation on nutrient-rich soil and period 1950-2018. The index uses 2000 as baseline year.

Table 3.65: Corresponding list of species for Socio-ecological groups (Stieperaere & Franssen 1982) regularly trampled pioneer vegetation on nutrient-rich soil together with their effect classification for the final year compared to 1950.
Multi-species index for species groups belonging to Socio-ecological groups (Stieperaere & Franssen 1982) regularly trampled pioneer vegetation on nutrient-rich soil and period 1990-2018. The index uses 2000 as baseline year.

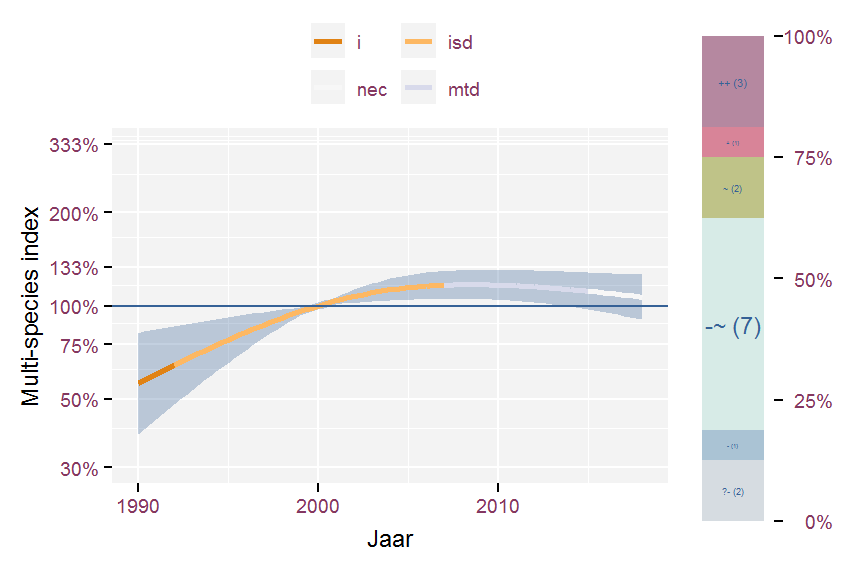
Figure 3.68: Multi-species index for species groups belonging to Socio-ecological groups (Stieperaere & Franssen 1982) regularly trampled pioneer vegetation on nutrient-rich soil and period 1990-2018. The index uses 2000 as baseline year.

Table 3.66: Corresponding list of species for Socio-ecological groups (Stieperaere & Franssen 1982) regularly trampled pioneer vegetation on nutrient-rich soil together with their effect classification for the final year compared to 1990.

3.3.25 rough herbaceous vegetation on little trampeld, nutrient-rich, rich, moderately dry soil

Multi-species index for species belonging to Socio-ecological groups (Stieperaere & Franssen 1982) rough herbaceous vegetation on little trampeld, nutrient-rich, rich, moderately dry soil and period 1950-2018. The index uses 2000 as baseline year.

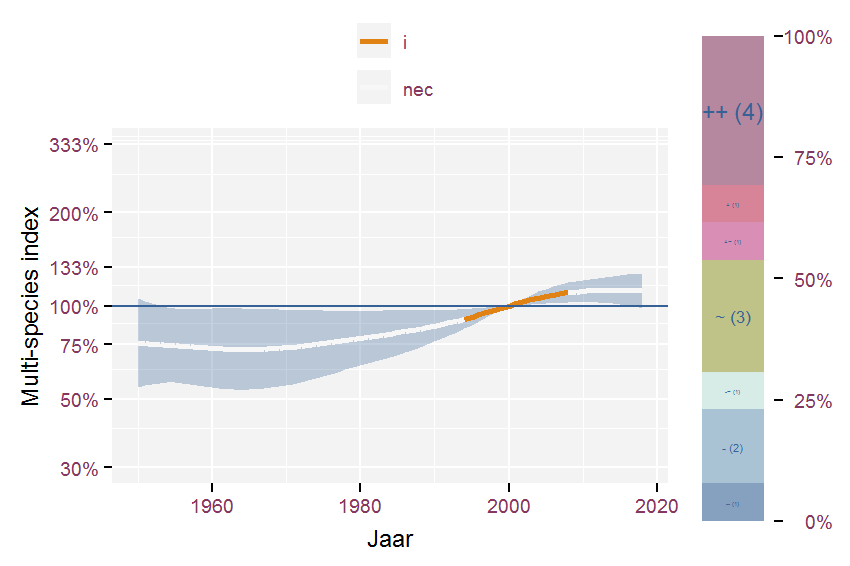
Figure 3.69: Multi-species index for species belonging to Socio-ecological groups (Stieperaere & Franssen 1982) rough herbaceous vegetation on little trampeld, nutrient-rich, rich, moderately dry soil and period 1950-2018. The index uses 2000 as baseline year.

Table 3.67: Corresponding list of species for Socio-ecological groups (Stieperaere & Franssen 1982) rough herbaceous vegetation on little trampeld, nutrient-rich, rich, moderately dry soil together with their effect classification for the final year compared to 1950.
Multi-species index for species groups belonging to Socio-ecological groups (Stieperaere & Franssen 1982) rough herbaceous vegetation on little trampeld, nutrient-rich, rich, moderately dry soil and period 1990-2018. The index uses 2000 as baseline year.

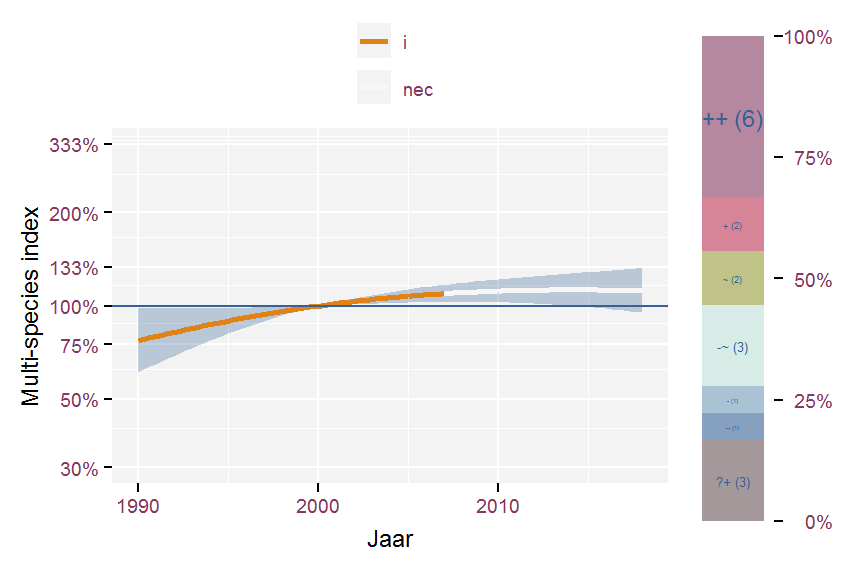
Figure 3.70: Multi-species index for species groups belonging to Socio-ecological groups (Stieperaere & Franssen 1982) rough herbaceous vegetation on little trampeld, nutrient-rich, rich, moderately dry soil and period 1990-2018. The index uses 2000 as baseline year.

Table 3.68: Corresponding list of species for Socio-ecological groups (Stieperaere & Franssen 1982) rough herbaceous vegetation on little trampeld, nutrient-rich, rich, moderately dry soil together with their effect classification for the final year compared to 1990.

3.3.26 rough herbaceous vegetation on little trampled calcareous, mineral, dry soil

Multi-species index for species belonging to Socio-ecological groups (Stieperaere & Franssen 1982) rough herbaceous vegetation on little trampled calcareous, mineral, dry soil and period 1950-2018. The index uses 2000 as baseline year.

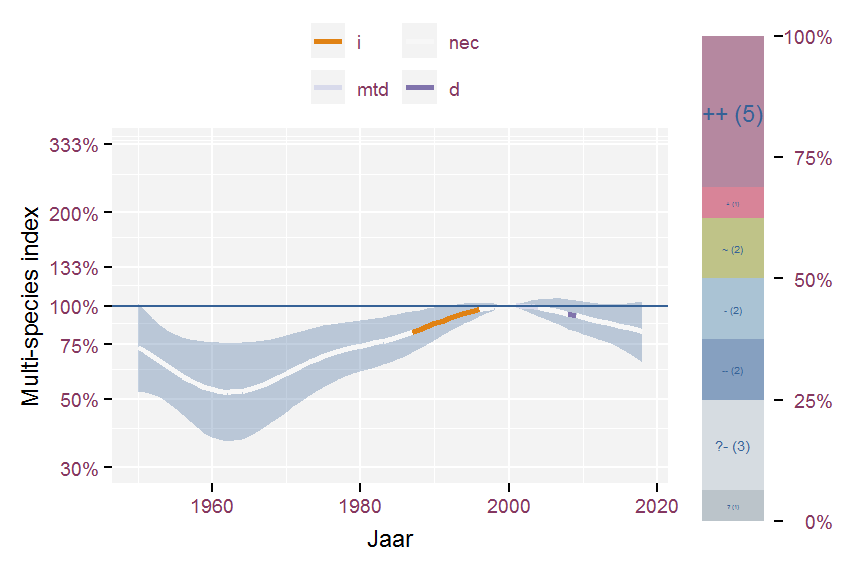
Figure 3.71: Multi-species index for species belonging to Socio-ecological groups (Stieperaere & Franssen 1982) rough herbaceous vegetation on little trampled calcareous, mineral, dry soil and period 1950-2018. The index uses 2000 as baseline year.

Table 3.69: Corresponding list of species for Socio-ecological groups (Stieperaere & Franssen 1982) rough herbaceous vegetation on little trampled calcareous, mineral, dry soil together with their effect classification for the final year compared to 1950.
Multi-species index for species groups belonging to Socio-ecological groups (Stieperaere & Franssen 1982) rough herbaceous vegetation on little trampled calcareous, mineral, dry soil and period 1990-2018. The index uses 2000 as baseline year.

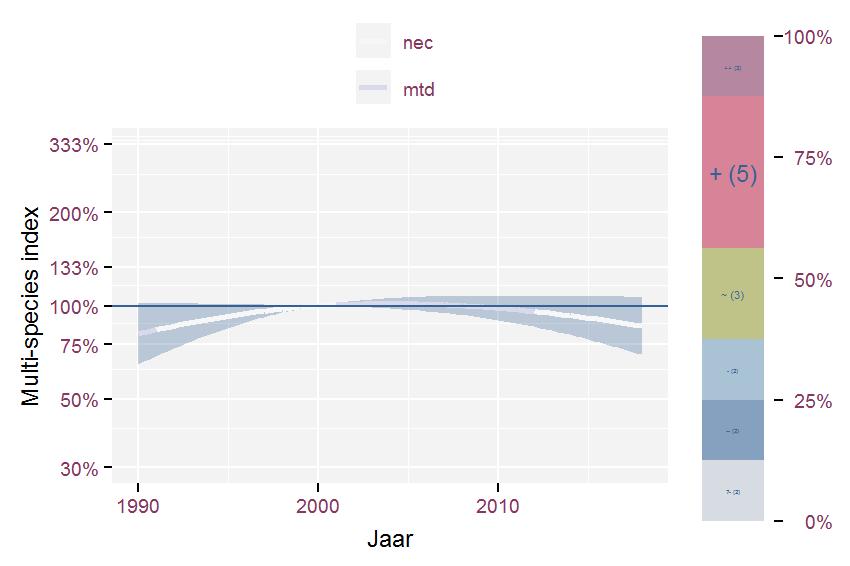
Figure 3.72: Multi-species index for species groups belonging to Socio-ecological groups (Stieperaere & Franssen 1982) rough herbaceous vegetation on little trampled calcareous, mineral, dry soil and period 1990-2018. The index uses 2000 as baseline year.

Table 3.70: Corresponding list of species for Socio-ecological groups (Stieperaere & Franssen 1982) rough herbaceous vegetation on little trampled calcareous, mineral, dry soil together with their effect classification for the final year compared to 1990.

3.3.27 rough herbaceous vegetation on trampled, nutrient-rich, not humic, weakly calcareous, dry soil

Multi-species index for species belonging to Socio-ecological groups (Stieperaere & Franssen 1982) rough herbaceous vegetation on trampled, nutrient-rich, not humic, weakly calcareous, dry soil and period 1950-2018. The index uses 2000 as baseline year.

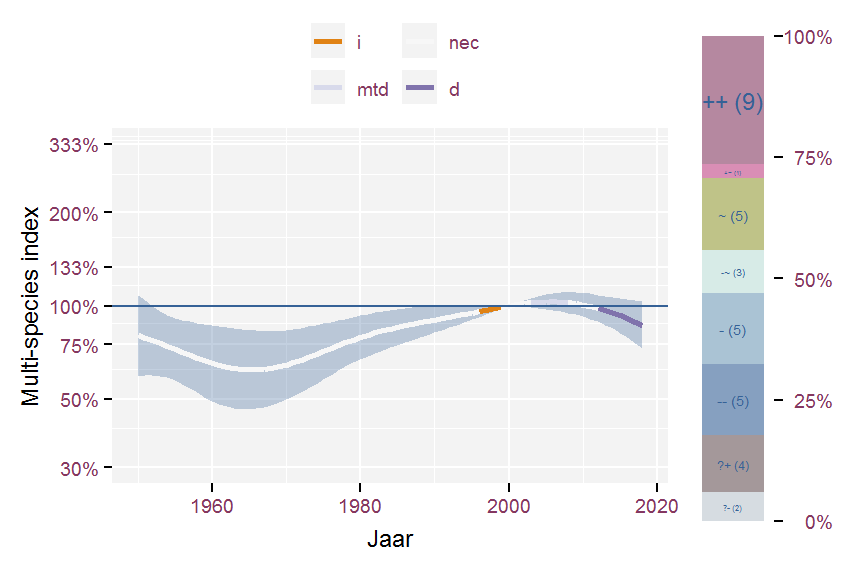
Figure 3.73: Multi-species index for species belonging to Socio-ecological groups (Stieperaere & Franssen 1982) rough herbaceous vegetation on trampled, nutrient-rich, not humic, weakly calcareous, dry soil and period 1950-2018. The index uses 2000 as baseline year.

Table 3.71: Corresponding list of species for Socio-ecological groups (Stieperaere & Franssen 1982) rough herbaceous vegetation on trampled, nutrient-rich, not humic, weakly calcareous, dry soil together with their effect classification for the final year compared to 1950.
Multi-species index for species groups belonging to Socio-ecological groups (Stieperaere & Franssen 1982) rough herbaceous vegetation on trampled, nutrient-rich, not humic, weakly calcareous, dry soil and period 1990-2018. The index uses 2000 as baseline year.

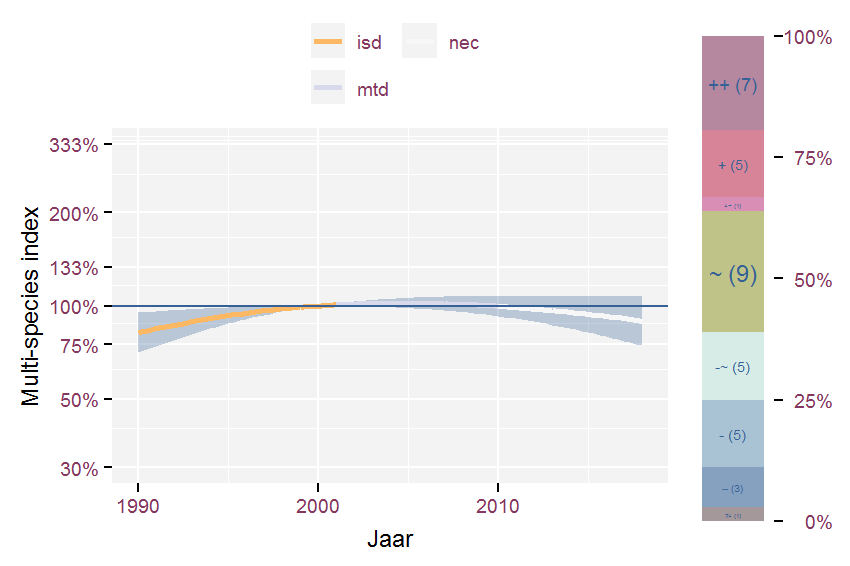
Figure 3.74: Multi-species index for species groups belonging to Socio-ecological groups (Stieperaere & Franssen 1982) rough herbaceous vegetation on trampled, nutrient-rich, not humic, weakly calcareous, dry soil and period 1990-2018. The index uses 2000 as baseline year.

Table 3.72: Corresponding list of species for Socio-ecological groups (Stieperaere & Franssen 1982) rough herbaceous vegetation on trampled, nutrient-rich, not humic, weakly calcareous, dry soil together with their effect classification for the final year compared to 1990.

3.3.28 shrub vegetation on moderately moist to dry, relatively nutrient-rich soil

Multi-species index for species belonging to Socio-ecological groups (Stieperaere & Franssen 1982) shrub vegetation on moderately moist to dry, relatively nutrient-rich soil and period 1950-2018. The index uses 2000 as baseline year.

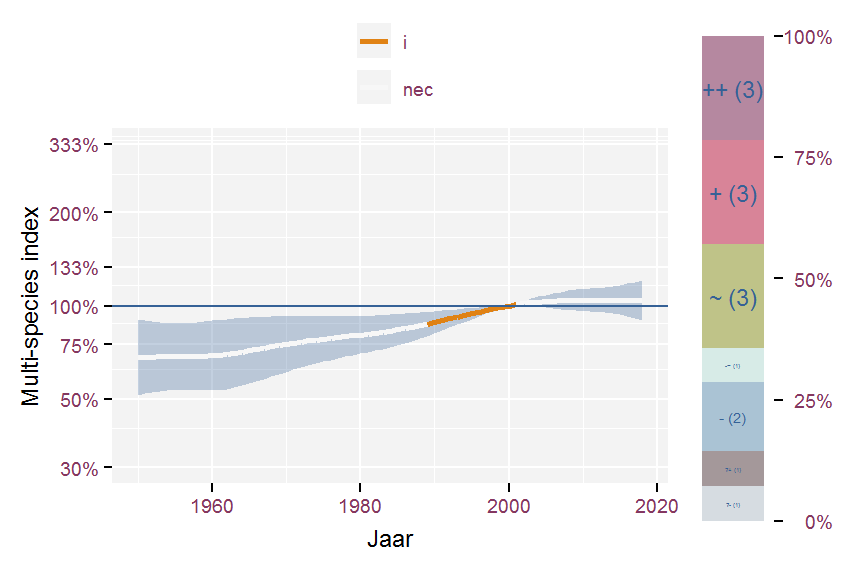
Figure 3.75: Multi-species index for species belonging to Socio-ecological groups (Stieperaere & Franssen 1982) shrub vegetation on moderately moist to dry, relatively nutrient-rich soil and period 1950-2018. The index uses 2000 as baseline year.

Table 3.73: Corresponding list of species for Socio-ecological groups (Stieperaere & Franssen 1982) shrub vegetation on moderately moist to dry, relatively nutrient-rich soil together with their effect classification for the final year compared to 1950.
Multi-species index for species groups belonging to Socio-ecological groups (Stieperaere & Franssen 1982) shrub vegetation on moderately moist to dry, relatively nutrient-rich soil and period 1990-2018. The index uses 2000 as baseline year.

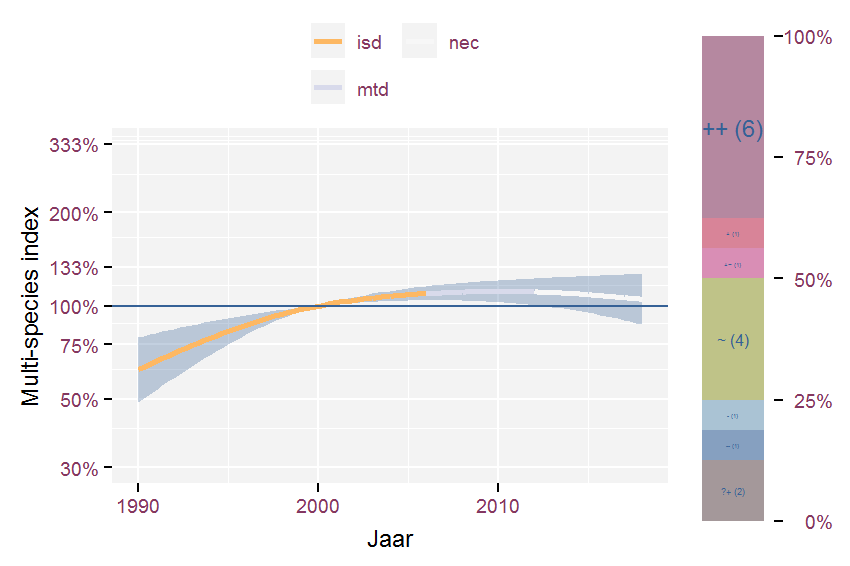
Figure 3.76: Multi-species index for species groups belonging to Socio-ecological groups (Stieperaere & Franssen 1982) shrub vegetation on moderately moist to dry, relatively nutrient-rich soil and period 1990-2018. The index uses 2000 as baseline year.

Table 3.74: Corresponding list of species for Socio-ecological groups (Stieperaere & Franssen 1982) shrub vegetation on moderately moist to dry, relatively nutrient-rich soil together with their effect classification for the final year compared to 1990.

3.3.29 unfertilized grasslands on moist to wet nutrient-poor, weakly acidic soil

Multi-species index for species belonging to Socio-ecological groups (Stieperaere & Franssen 1982) unfertilized grasslands on moist to wet nutrient-poor, weakly acidic soil and period 1950-2018. The index uses 2000 as baseline year.

Figure 3.77: Multi-species index for species belonging to Socio-ecological groups (Stieperaere & Franssen 1982) unfertilized grasslands on moist to wet nutrient-poor, weakly acidic soil and period 1950-2018. The index uses 2000 as baseline year.

Table 3.75: Corresponding list of species for Socio-ecological groups (Stieperaere & Franssen 1982) unfertilized grasslands on moist to wet nutrient-poor, weakly acidic soil together with their effect classification for the final year compared to 1950.
Multi-species index for species groups belonging to Socio-ecological groups (Stieperaere & Franssen 1982) unfertilized grasslands on moist to wet nutrient-poor, weakly acidic soil and period 1990-2018. The index uses 2000 as baseline year.

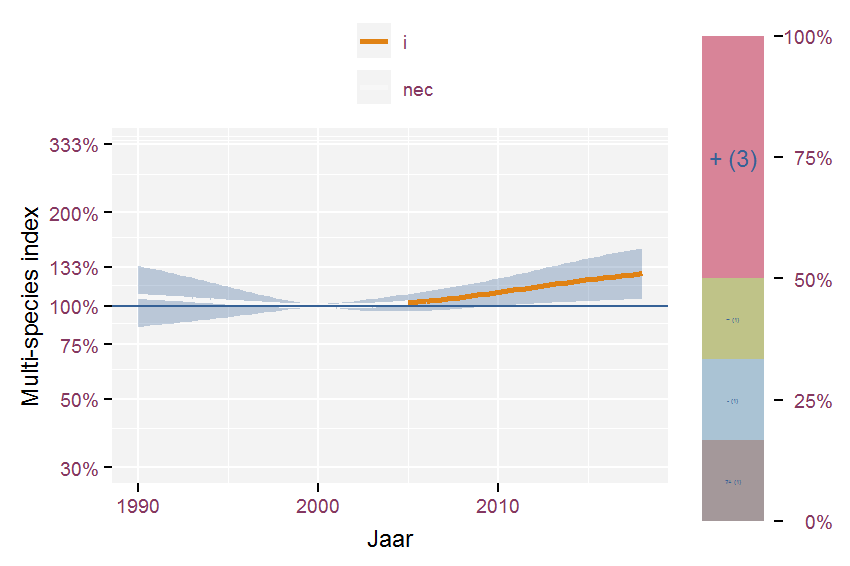
Figure 3.78: Multi-species index for species groups belonging to Socio-ecological groups (Stieperaere & Franssen 1982) unfertilized grasslands on moist to wet nutrient-poor, weakly acidic soil and period 1990-2018. The index uses 2000 as baseline year.

Table 3.76: Corresponding list of species for Socio-ecological groups (Stieperaere & Franssen 1982) unfertilized grasslands on moist to wet nutrient-poor, weakly acidic soil together with their effect classification for the final year compared to 1990.

3.3.30 unfertilized Nardus grasslands on moderately moist to dry, nutrient-poor, acidic, humus-rich soil

Multi-species index for species belonging to Socio-ecological groups (Stieperaere & Franssen 1982) unfertilized Nardus grasslands on moderately moist to dry, nutrient-poor, acidic, humus-rich soil and period 1950-2018. The index uses 2000 as baseline year.

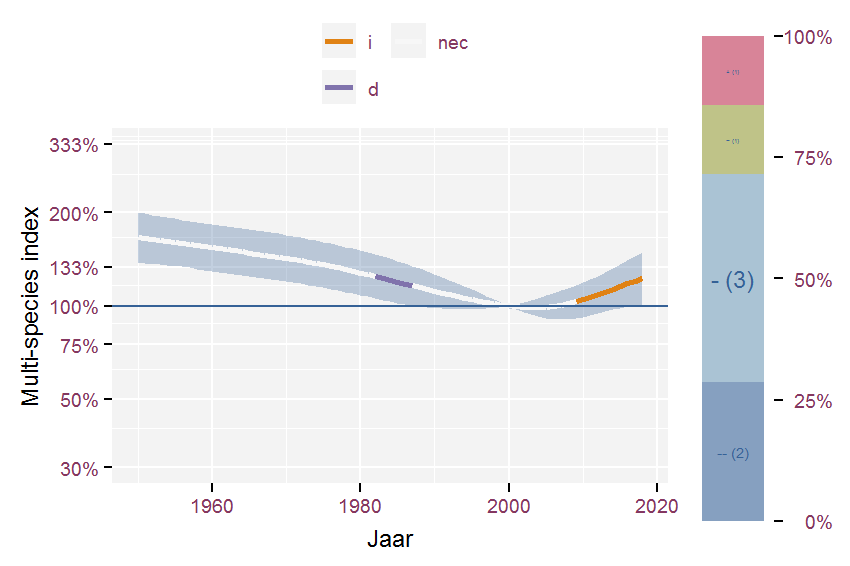
Figure 3.79: Multi-species index for species belonging to Socio-ecological groups (Stieperaere & Franssen 1982) unfertilized Nardus grasslands on moderately moist to dry, nutrient-poor, acidic, humus-rich soil and period 1950-2018. The index uses 2000 as baseline year.

Table 3.77: Corresponding list of species for Socio-ecological groups (Stieperaere & Franssen 1982) unfertilized Nardus grasslands on moderately moist to dry, nutrient-poor, acidic, humus-rich soil together with their effect classification for the final year compared to 1950.
Multi-species index for species groups belonging to Socio-ecological groups (Stieperaere & Franssen 1982) unfertilized Nardus grasslands on moderately moist to dry, nutrient-poor, acidic, humus-rich soil and period 1990-2018. The index uses 2000 as baseline year.

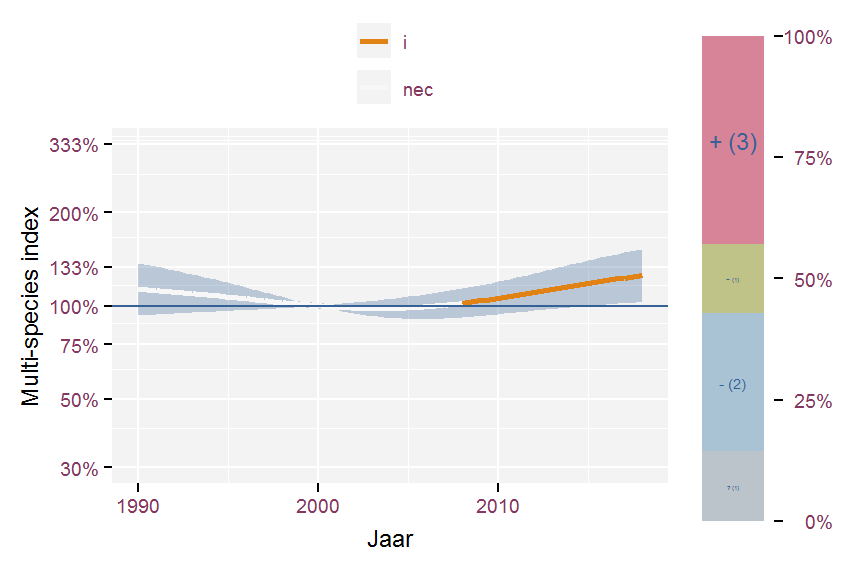
Figure 3.80: Multi-species index for species groups belonging to Socio-ecological groups (Stieperaere & Franssen 1982) unfertilized Nardus grasslands on moderately moist to dry, nutrient-poor, acidic, humus-rich soil and period 1990-2018. The index uses 2000 as baseline year.

Table 3.78: Corresponding list of species for Socio-ecological groups (Stieperaere & Franssen 1982) unfertilized Nardus grasslands on moderately moist to dry, nutrient-poor, acidic, humus-rich soil together with their effect classification for the final year compared to 1990.

3.3.31 walls and rocks

Multi-species index for species belonging to Socio-ecological groups (Stieperaere & Franssen 1982) walls and rocks and period 1950-2018. The index uses 2000 as baseline year.

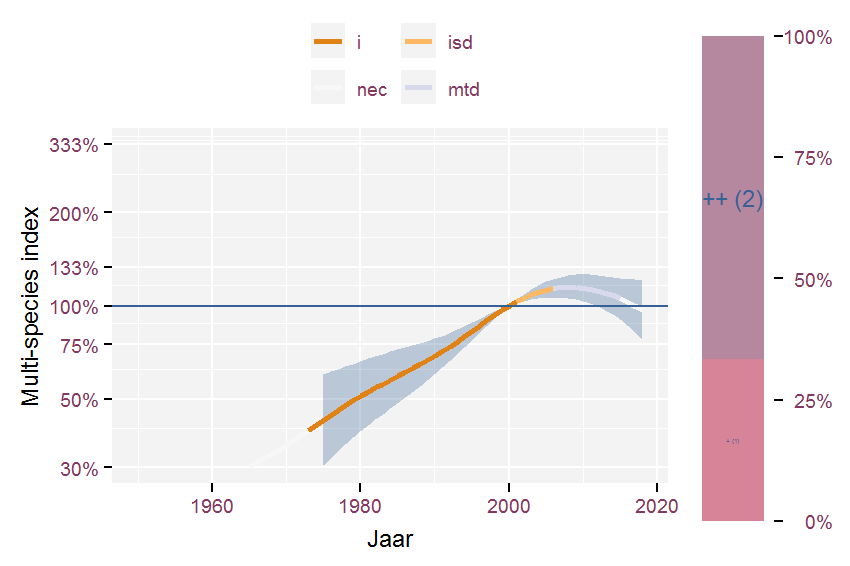
Figure 3.81: Multi-species index for species belonging to Socio-ecological groups (Stieperaere & Franssen 1982) walls and rocks and period 1950-2018. The index uses 2000 as baseline year.

Table 3.79: Corresponding list of species for Socio-ecological groups (Stieperaere & Franssen 1982) walls and rocks together with their effect classification for the final year compared to 1950.
Multi-species index for species groups belonging to Socio-ecological groups (Stieperaere & Franssen 1982) walls and rocks and period 1990-2018. The index uses 2000 as baseline year.

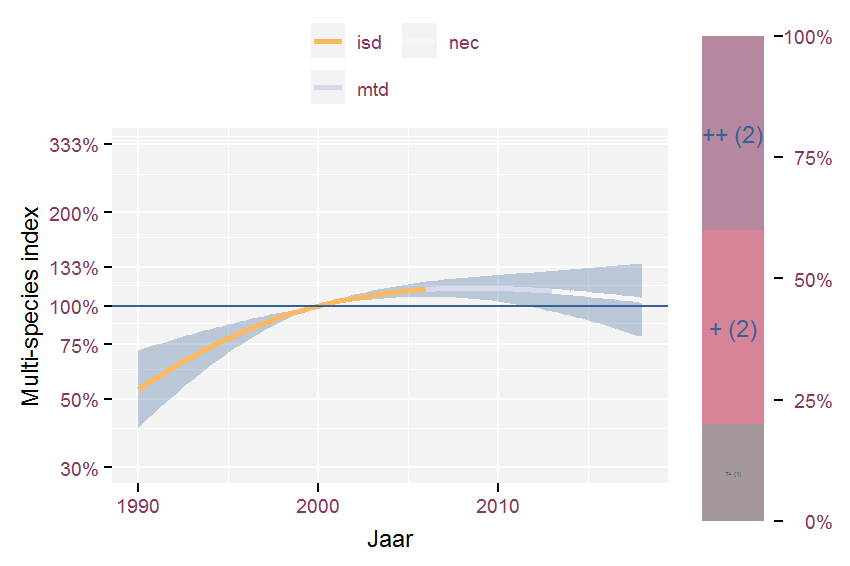
Figure 3.82: Multi-species index for species groups belonging to Socio-ecological groups (Stieperaere & Franssen 1982) walls and rocks and period 1990-2018. The index uses 2000 as baseline year.

Table 3.80: Corresponding list of species for Socio-ecological groups (Stieperaere & Franssen 1982) walls and rocks together with their effect classification for the final year compared to 1990.

3.3.32 young forest plantations and forest verges on nutrient rich, neutral, humic moderately moist to dry soil

Multi-species index for species belonging to Socio-ecological groups (Stieperaere & Franssen 1982) young forest plantations and forest verges on nutrient rich, neutral, humic moderately moist to dry soil and period 1950-2018. The index uses 2000 as baseline year.

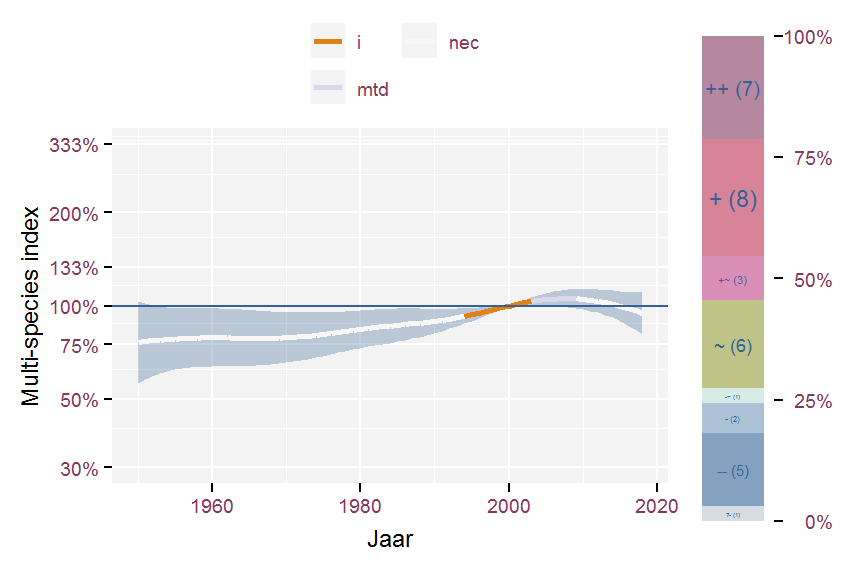
Figure 3.83: Multi-species index for species belonging to Socio-ecological groups (Stieperaere & Franssen 1982) young forest plantations and forest verges on nutrient rich, neutral, humic moderately moist to dry soil and period 1950-2018. The index uses 2000 as baseline year.

Table 3.81: Corresponding list of species for Socio-ecological groups (Stieperaere & Franssen 1982) young forest plantations and forest verges on nutrient rich, neutral, humic moderately moist to dry soil together with their effect classification for the final year compared to 1950.
Multi-species index for species groups belonging to Socio-ecological groups (Stieperaere & Franssen 1982) young forest plantations and forest verges on nutrient rich, neutral, humic moderately moist to dry soil and period 1990-2018. The index uses 2000 as baseline year.

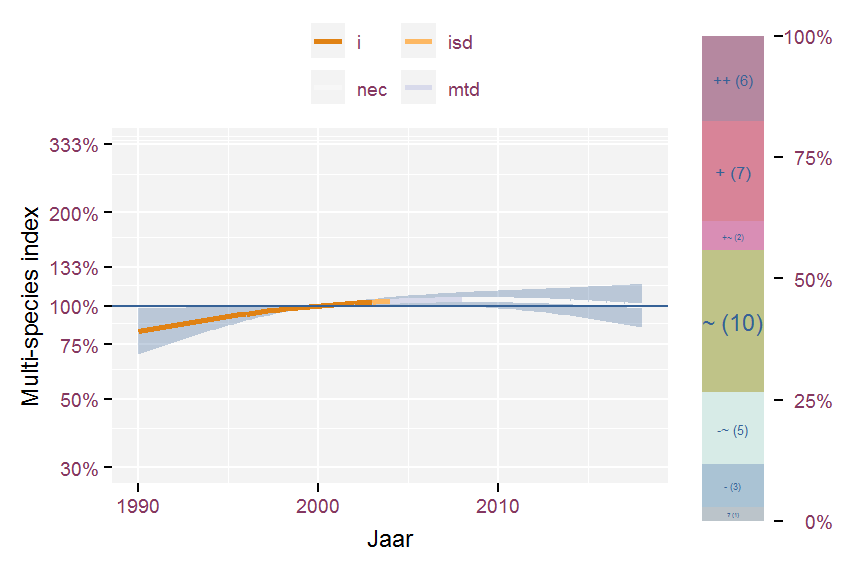
Figure 3.84: Multi-species index for species groups belonging to Socio-ecological groups (Stieperaere & Franssen 1982) young forest plantations and forest verges on nutrient rich, neutral, humic moderately moist to dry soil and period 1990-2018. The index uses 2000 as baseline year.

Table 3.82: Corresponding list of species for Socio-ecological groups (Stieperaere & Franssen 1982) young forest plantations and forest verges on nutrient rich, neutral, humic moderately moist to dry soil together with their effect classification for the final year compared to 1990.

3.4 Attributes indicating environmental conditions

3.4.1 nutrient availabity (Runhaar et al. 2004)

Multi-species index for species groups determined by nutrient availabity (Runhaar et al. 2004) and period 1950-2018. The index uses 2000 as baseline year.

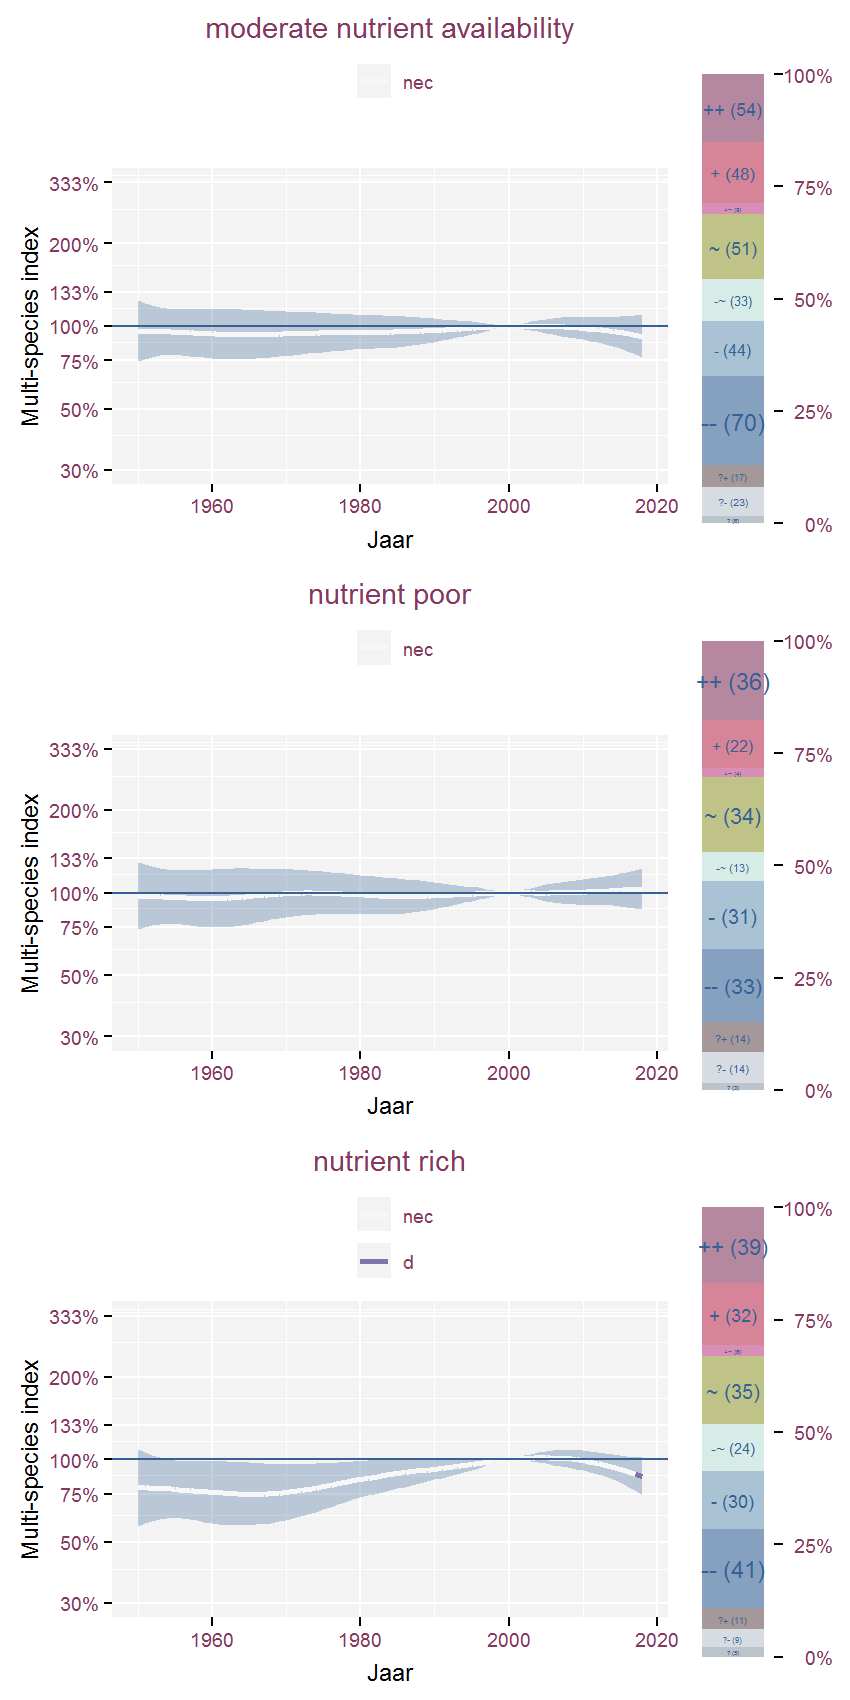
Figure 3.85: Multi-species index for species groups determined by nutrient availabity (Runhaar et al. 2004) and period 1950-2018. The index uses 2000 as baseline year.

Table 3.83: Corresponding list of species for nutrient availabity (Runhaar et al. 2004) together with their effect classification for the final year compared to 1950.
Multi-species index for species groups determined by nutrient availabity (Runhaar et al. 2004) and period 1990-2018. The index uses 2000 as baseline year.

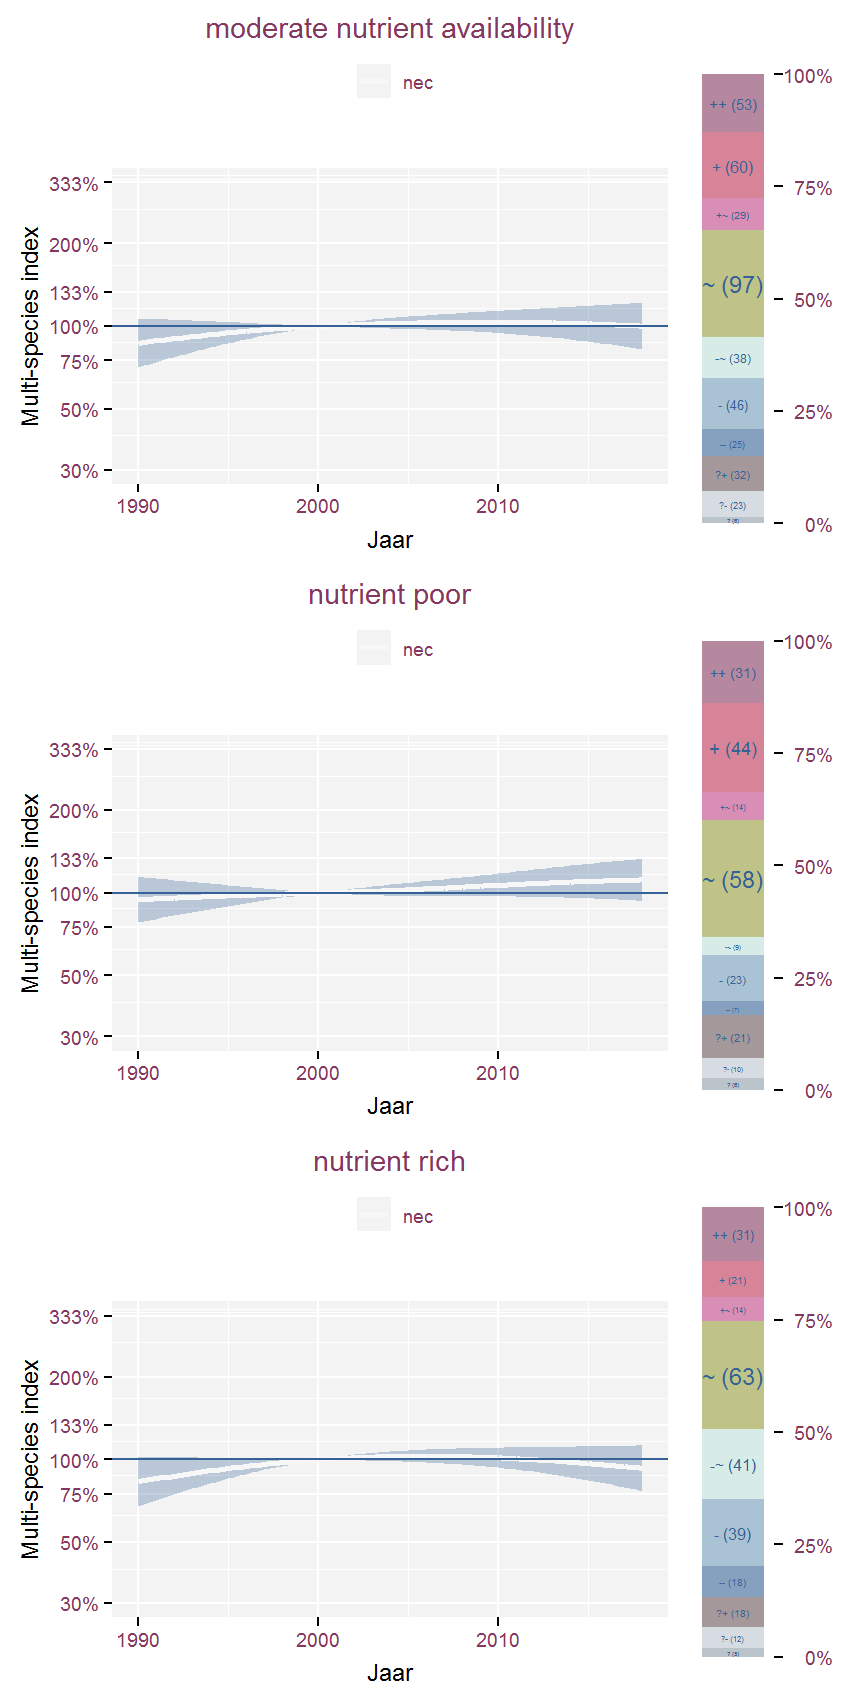
Figure 3.86: Multi-species index for species groups determined by nutrient availabity (Runhaar et al. 2004) and period 1990-2018. The index uses 2000 as baseline year.

Table 3.84: Corresponding list of species for nutrient availabity (Runhaar et al. 2004) together with their effect classification for the final year compared to 1990.

3.4.2 Ellenberg nitrogen value (regrouped)

Multi-species index for species groups determined by Ellenberg nitrogen value (regrouped) and period 1950-2018. The index uses 2000 as baseline year.

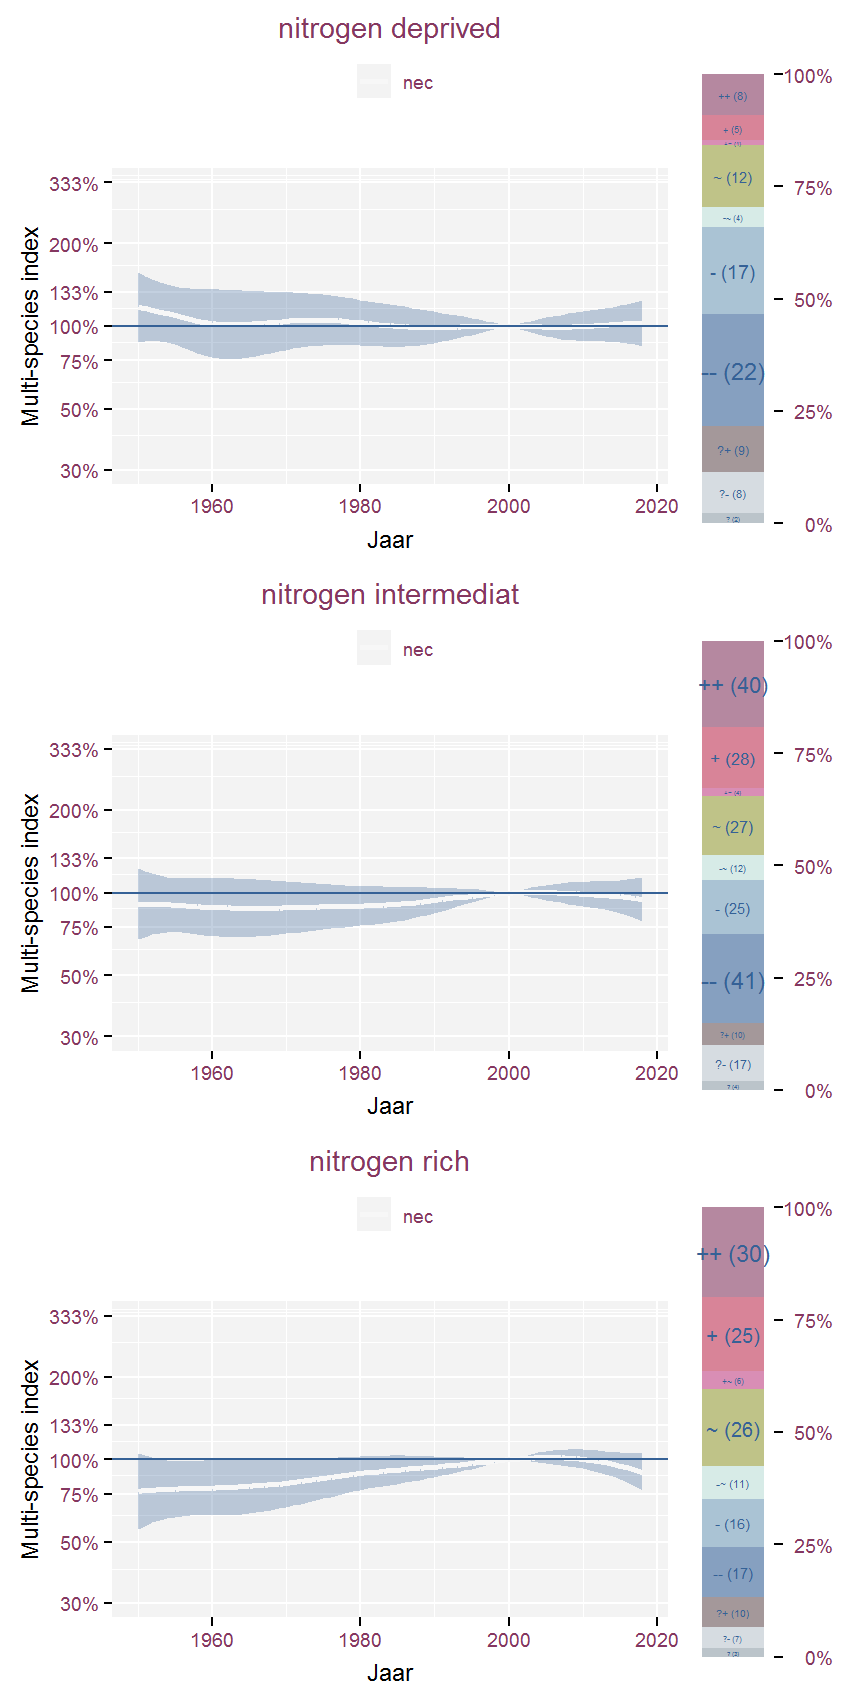
Figure 3.87: Multi-species index for species groups determined by Ellenberg nitrogen value (regrouped) and period 1950-2018. The index uses 2000 as baseline year.

Multi-species index for Ellenberg nitrogen value (regrouped) and period 1950-2018. The index uses 2000 as baseline year and Ellenberg ordinal values as weights.

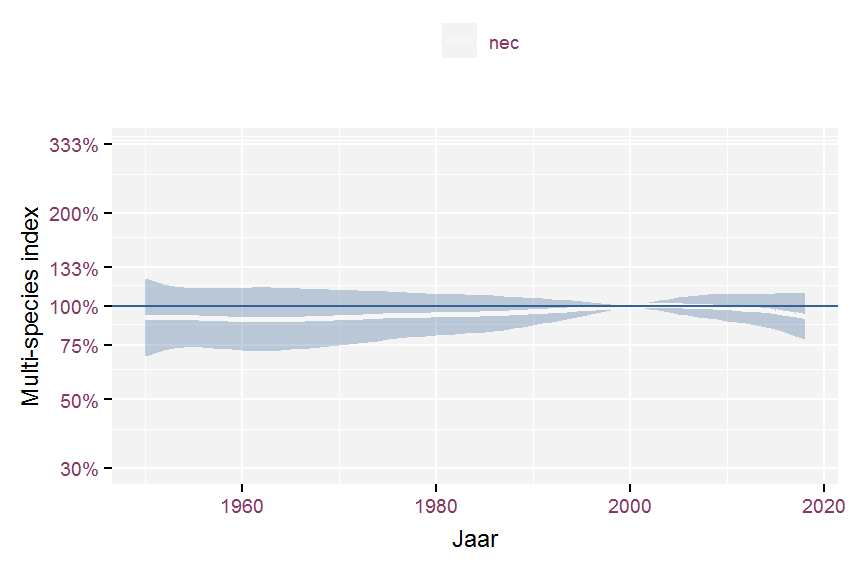
Figure 3.88: Multi-species index for Ellenberg nitrogen value (regrouped) and period 1950-2018. The index uses 2000 as baseline year and Ellenberg ordinal values as weights.

Table 3.85: Corresponding list of species for Ellenberg nitrogen value (regrouped) together with their effect classification for the final year compared to 1950.
Multi-species index for species groups determined by Ellenberg nitrogen value (regrouped) and period 1990-2018. The index uses 2000 as baseline year.

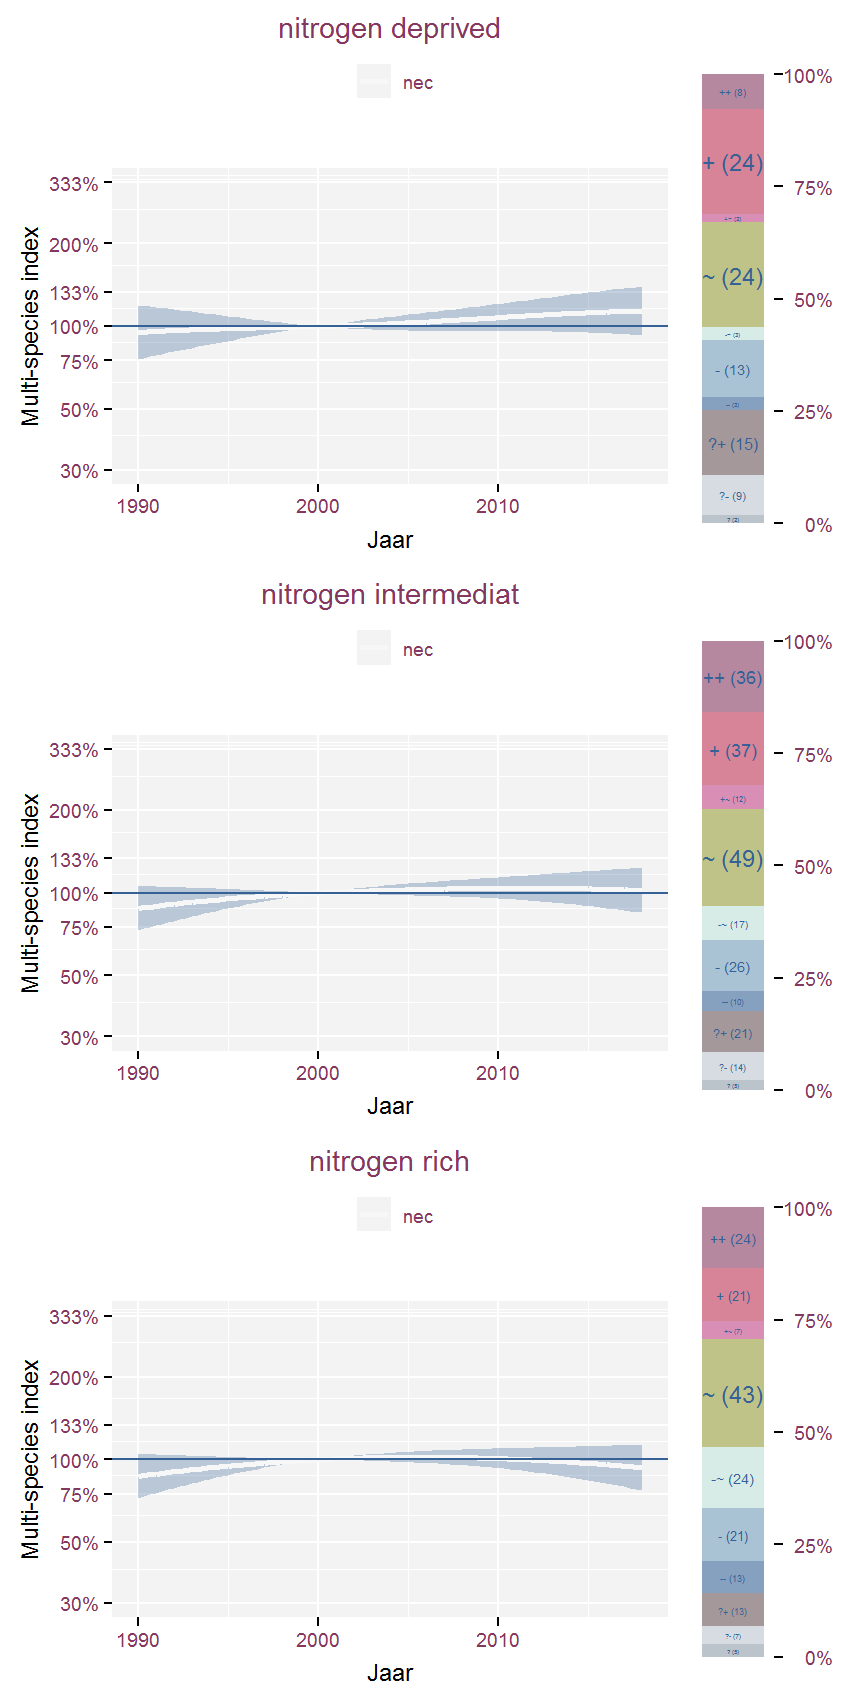
Figure 3.89: Multi-species index for species groups determined by Ellenberg nitrogen value (regrouped) and period 1990-2018. The index uses 2000 as baseline year.

Multi-species index for Ellenberg nitrogen value (regrouped) and period 1990-2018. The index uses 2000 as baseline year and Ellenberg ordinal values as weights.

Figure 3.90: )Multi-species index for Ellenberg nitrogen value (regrouped) and period 1990-2018. The index uses 2000 as baseline year and Ellenberg ordinal values as weights.

Table 3.86: Corresponding list of species for Ellenberg nitrogen value (regrouped) together with their effect classification for the final year compared to 1990.

3.4.3 Ellenberg reaction value (regrouped)

Multi-species index for species groups determined by Ellenberg reaction value (regrouped) and period 1950-2018. The index uses 2000 as baseline year.

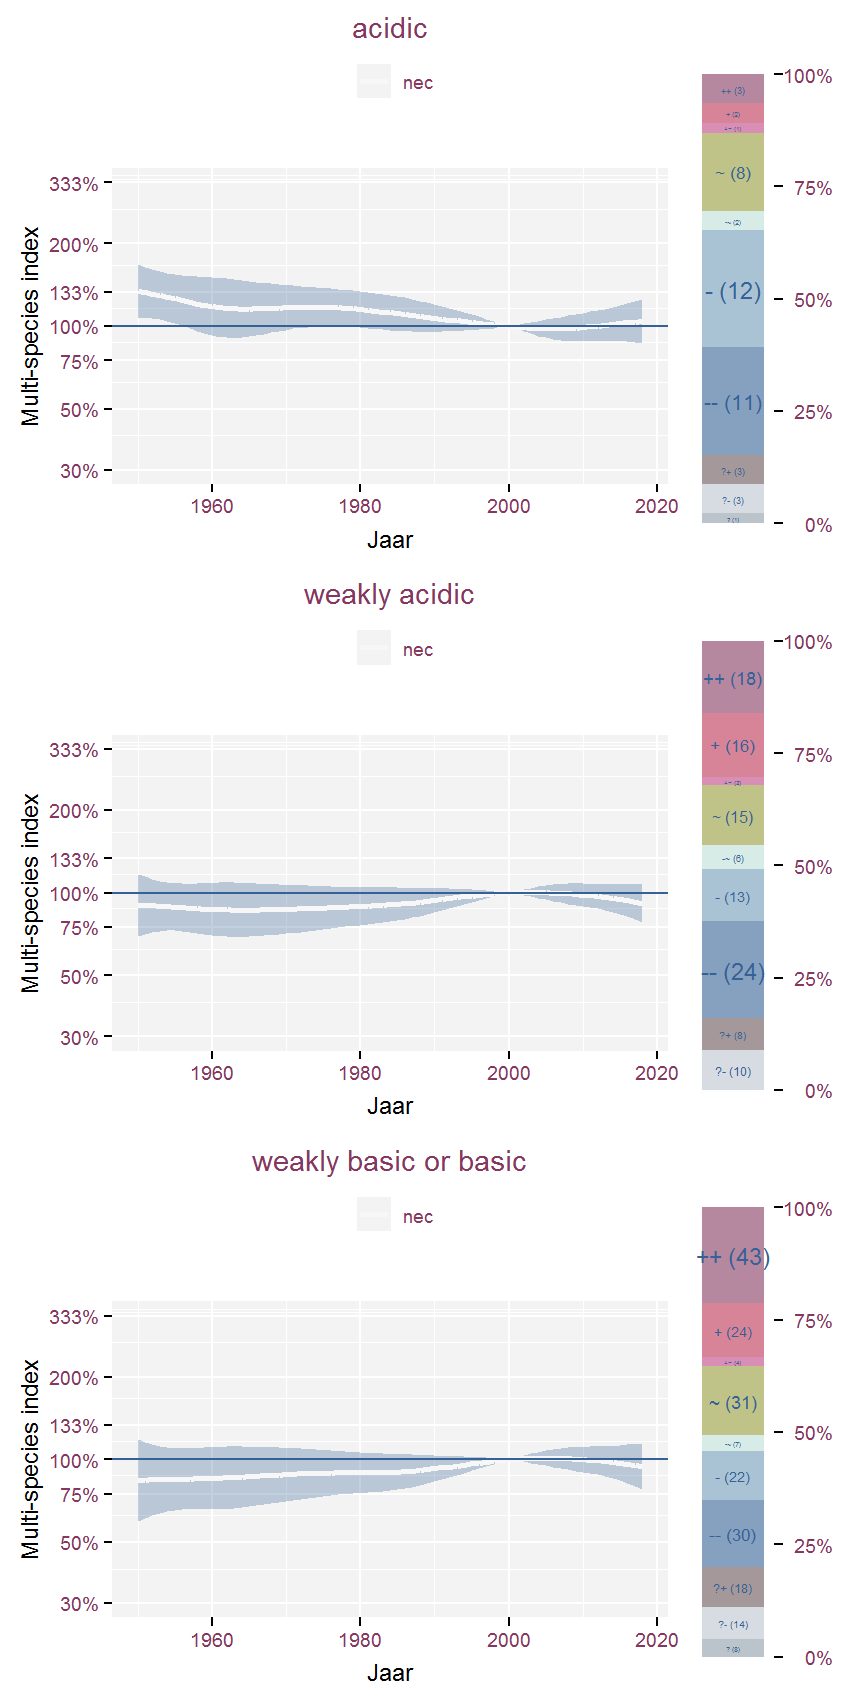
Figure 3.91: Multi-species index for species groups determined by Ellenberg reaction value (regrouped) and period 1950-2018. The index uses 2000 as baseline year.

Multi-species index for Ellenberg reaction value (regrouped) and period 1950-2018. The index uses 2000 as baseline year and Ellenberg ordinal values as weights.

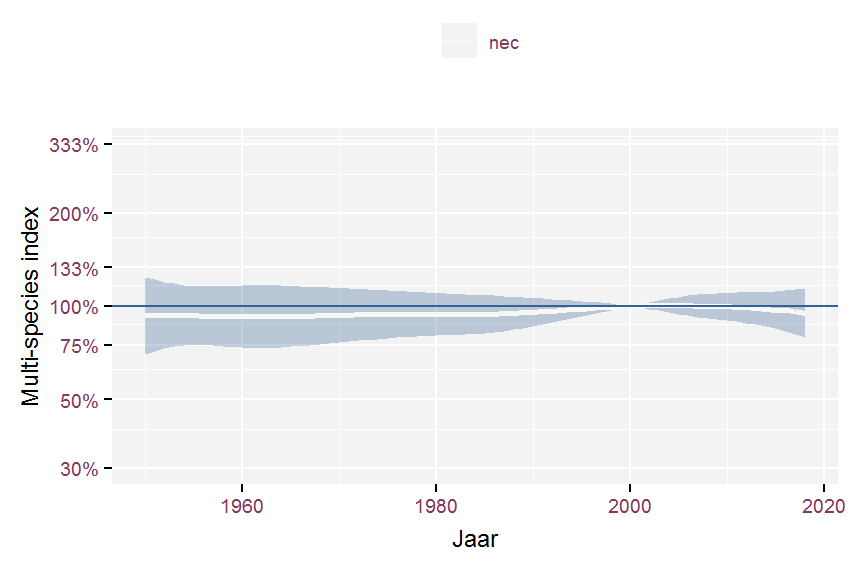
Figure 3.92: Multi-species index for Ellenberg reaction value (regrouped) and period 1950-2018. The index uses 2000 as baseline year and Ellenberg ordinal values as weights.

Table 3.87: Corresponding list of species for Ellenberg reaction value (regrouped) together with their effect classification for the final year compared to 1950.
Multi-species index for species groups determined by Ellenberg reaction value (regrouped) and period 1990-2018. The index uses 2000 as baseline year.

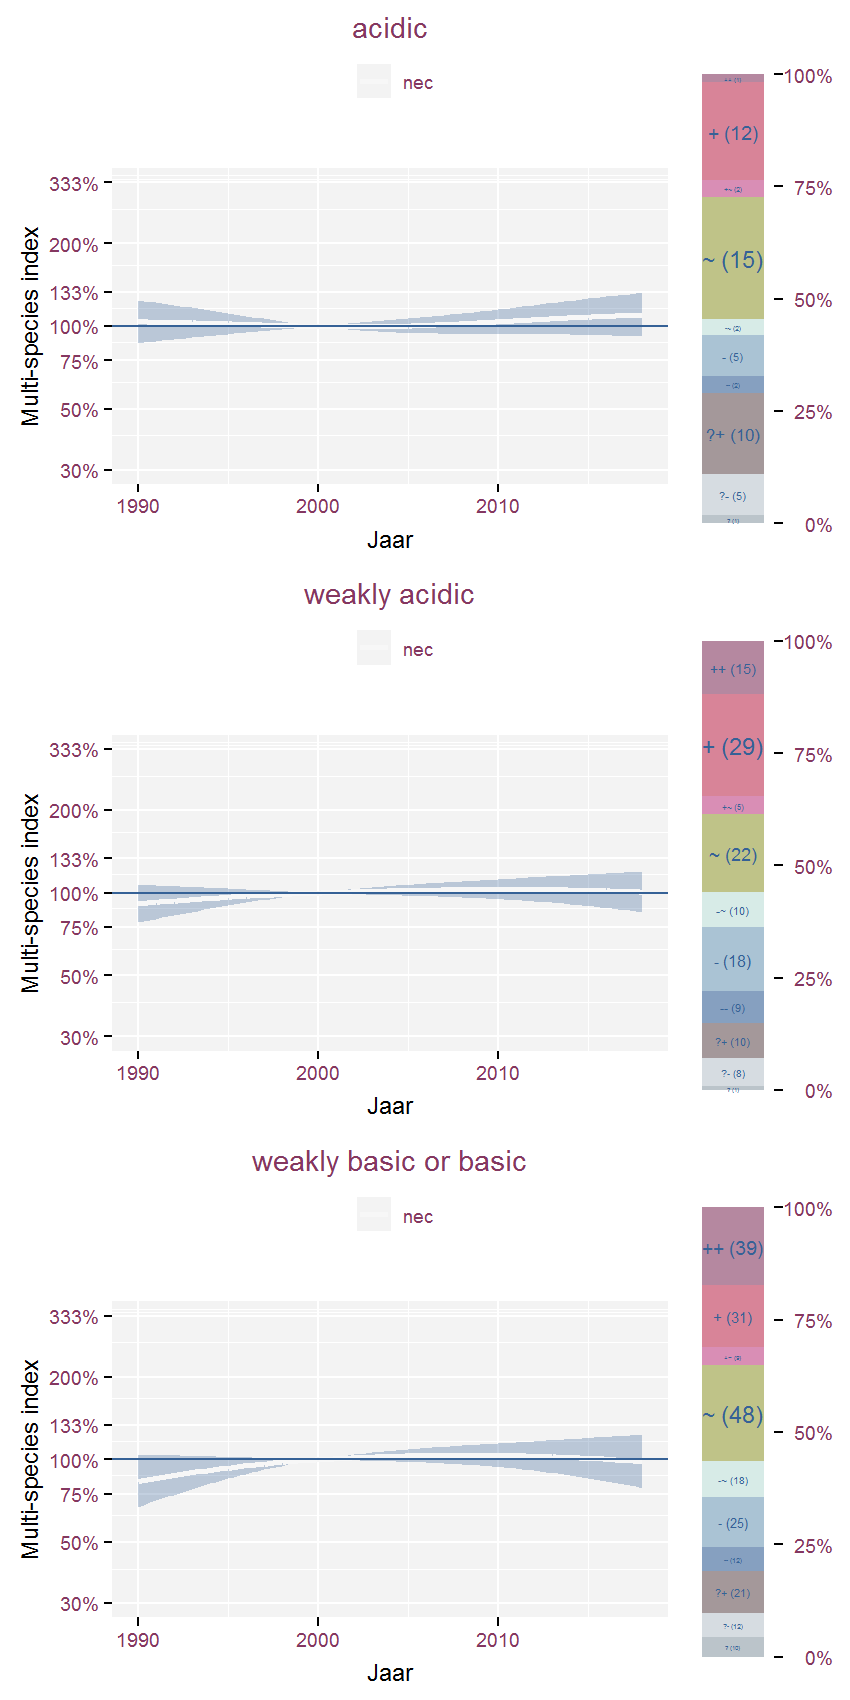
Figure 3.93: Multi-species index for species groups determined by Ellenberg reaction value (regrouped) and period 1990-2018. The index uses 2000 as baseline year.

Multi-species index for Ellenberg reaction value (regrouped) and period 1990-2018. The index uses 2000 as baseline year and Ellenberg ordinal values as weights.

Figure 3.94: )Multi-species index for Ellenberg reaction value (regrouped) and period 1990-2018. The index uses 2000 as baseline year and Ellenberg ordinal values as weights.

Table 3.88: Corresponding list of species for Ellenberg reaction value (regrouped) together with their effect classification for the final year compared to 1990.

3.4.4 Ellenberg temperature value (regrouped)

Multi-species index for species groups determined by Ellenberg temperature value (regrouped) and period 1950-2018. The index uses 2000 as baseline year.

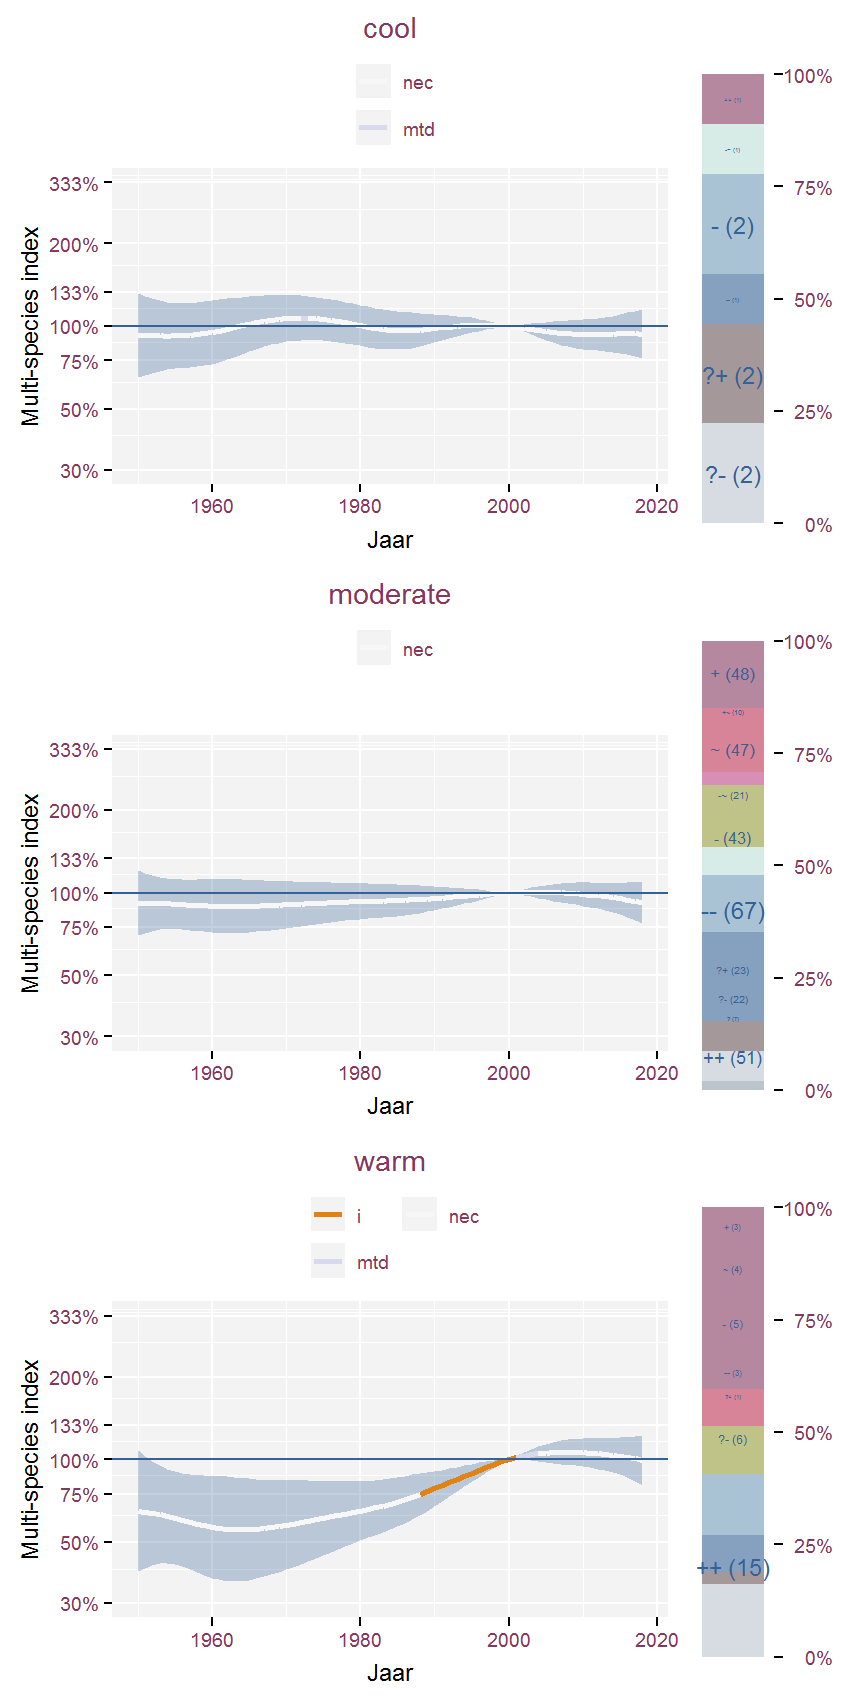
Figure 3.95: Multi-species index for species groups determined by Ellenberg temperature value (regrouped) and period 1950-2018. The index uses 2000 as baseline year.

Multi-species index for Ellenberg temperature value (regrouped) and period 1950-2018. The index uses 2000 as baseline year and Ellenberg ordinal values as weights.

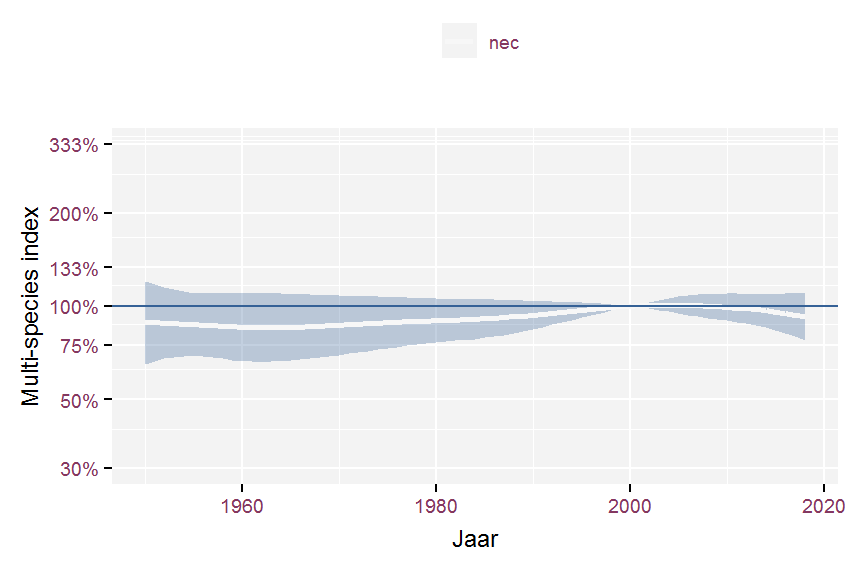
Figure 3.96: Multi-species index for Ellenberg temperature value (regrouped) and period 1950-2018. The index uses 2000 as baseline year and Ellenberg ordinal values as weights.

Table 3.89: Corresponding list of species for Ellenberg temperature value (regrouped) together with their effect classification for the final year compared to 1950.
Multi-species index for species groups determined by Ellenberg temperature value (regrouped) and period 1990-2018. The index uses 2000 as baseline year.

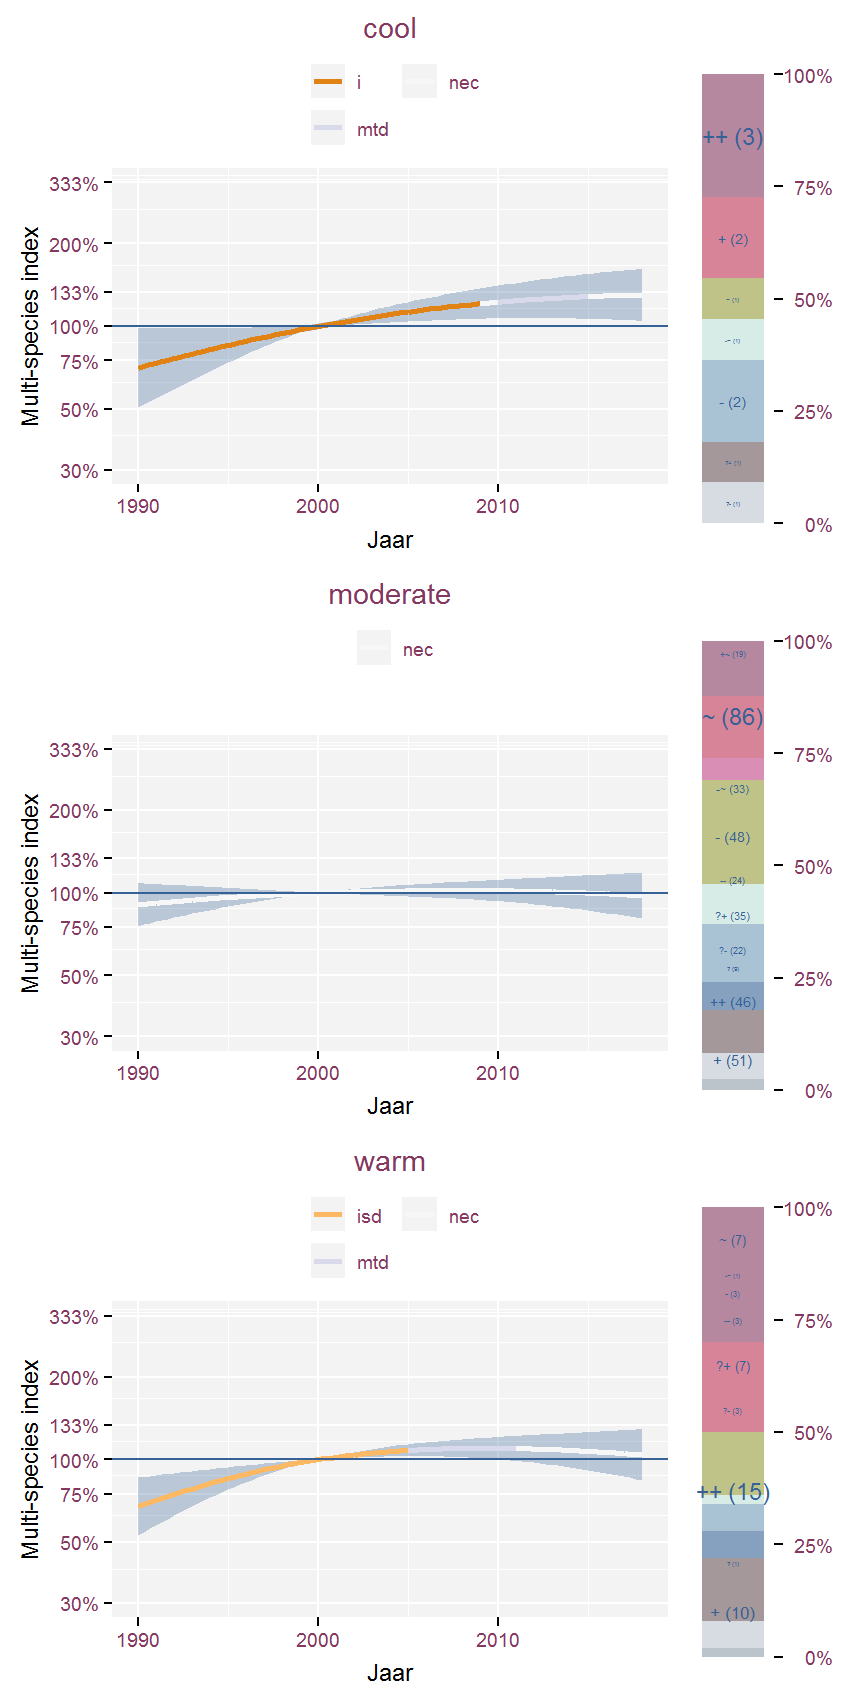
Figure 3.97: Multi-species index for species groups determined by Ellenberg temperature value (regrouped) and period 1990-2018. The index uses 2000 as baseline year.

Multi-species index for Ellenberg temperature value (regrouped) and period 1990-2018. The index uses 2000 as baseline year and Ellenberg ordinal values as weights.

Figure 3.98: )Multi-species index for Ellenberg temperature value (regrouped) and period 1990-2018. The index uses 2000 as baseline year and Ellenberg ordinal values as weights.

Table 3.90: Corresponding list of species for Ellenberg temperature value (regrouped) together with their effect classification for the final year compared to 1990.

3.4.5 Ellenberg humidity value (regrouped)

Multi-species index for species groups determined by Ellenberg humidity value (regrouped) and period 1950-2018. The index uses 2000 as baseline year.

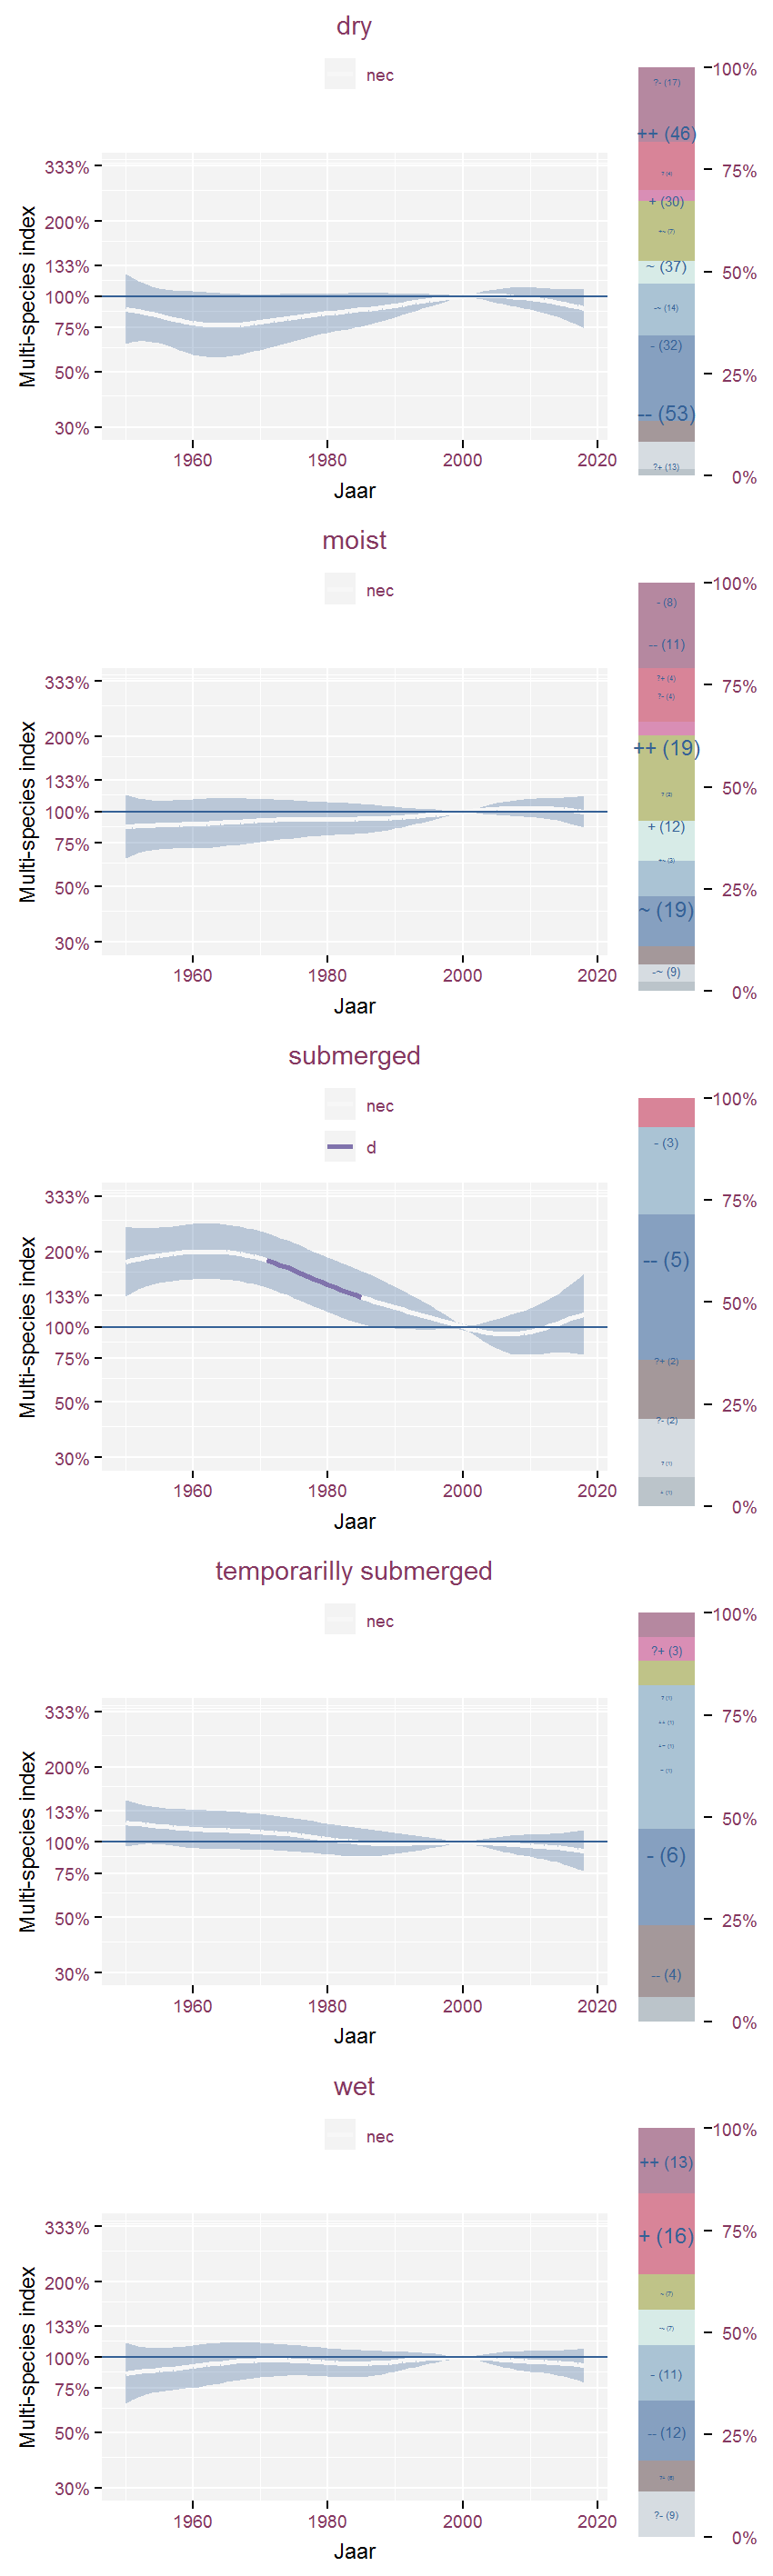
Figure 3.99: Multi-species index for species groups determined by Ellenberg humidity value (regrouped) and period 1950-2018. The index uses 2000 as baseline year.

Multi-species index for Ellenberg humidity value (regrouped) and period 1950-2018. The index uses 2000 as baseline year and Ellenberg ordinal values as weights.

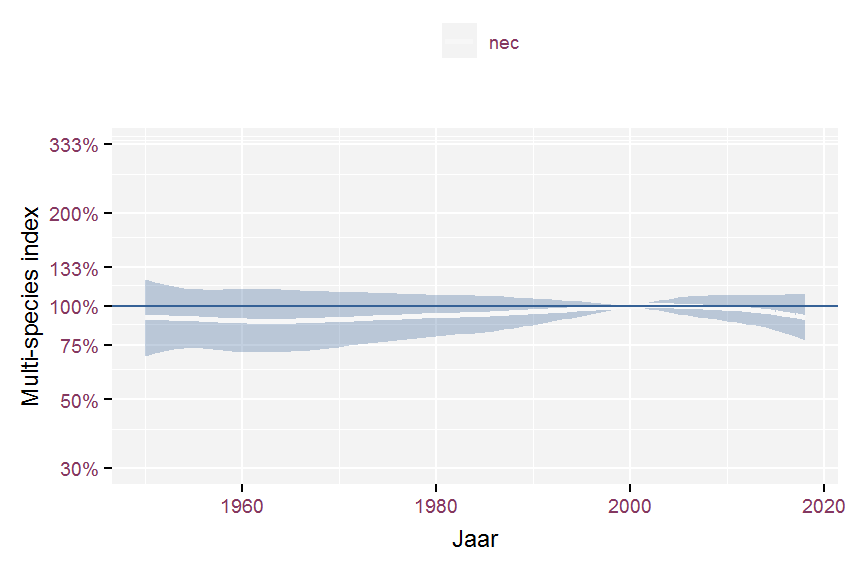
Figure 3.100: Multi-species index for Ellenberg humidity value (regrouped) and period 1950-2018. The index uses 2000 as baseline year and Ellenberg ordinal values as weights.

Table 3.91: Corresponding list of species for Ellenberg humidity value (regrouped) together with their effect classification for the final year compared to 1950.
Multi-species index for species groups determined by Ellenberg humidity value (regrouped) and period 1990-2018. The index uses 2000 as baseline year.

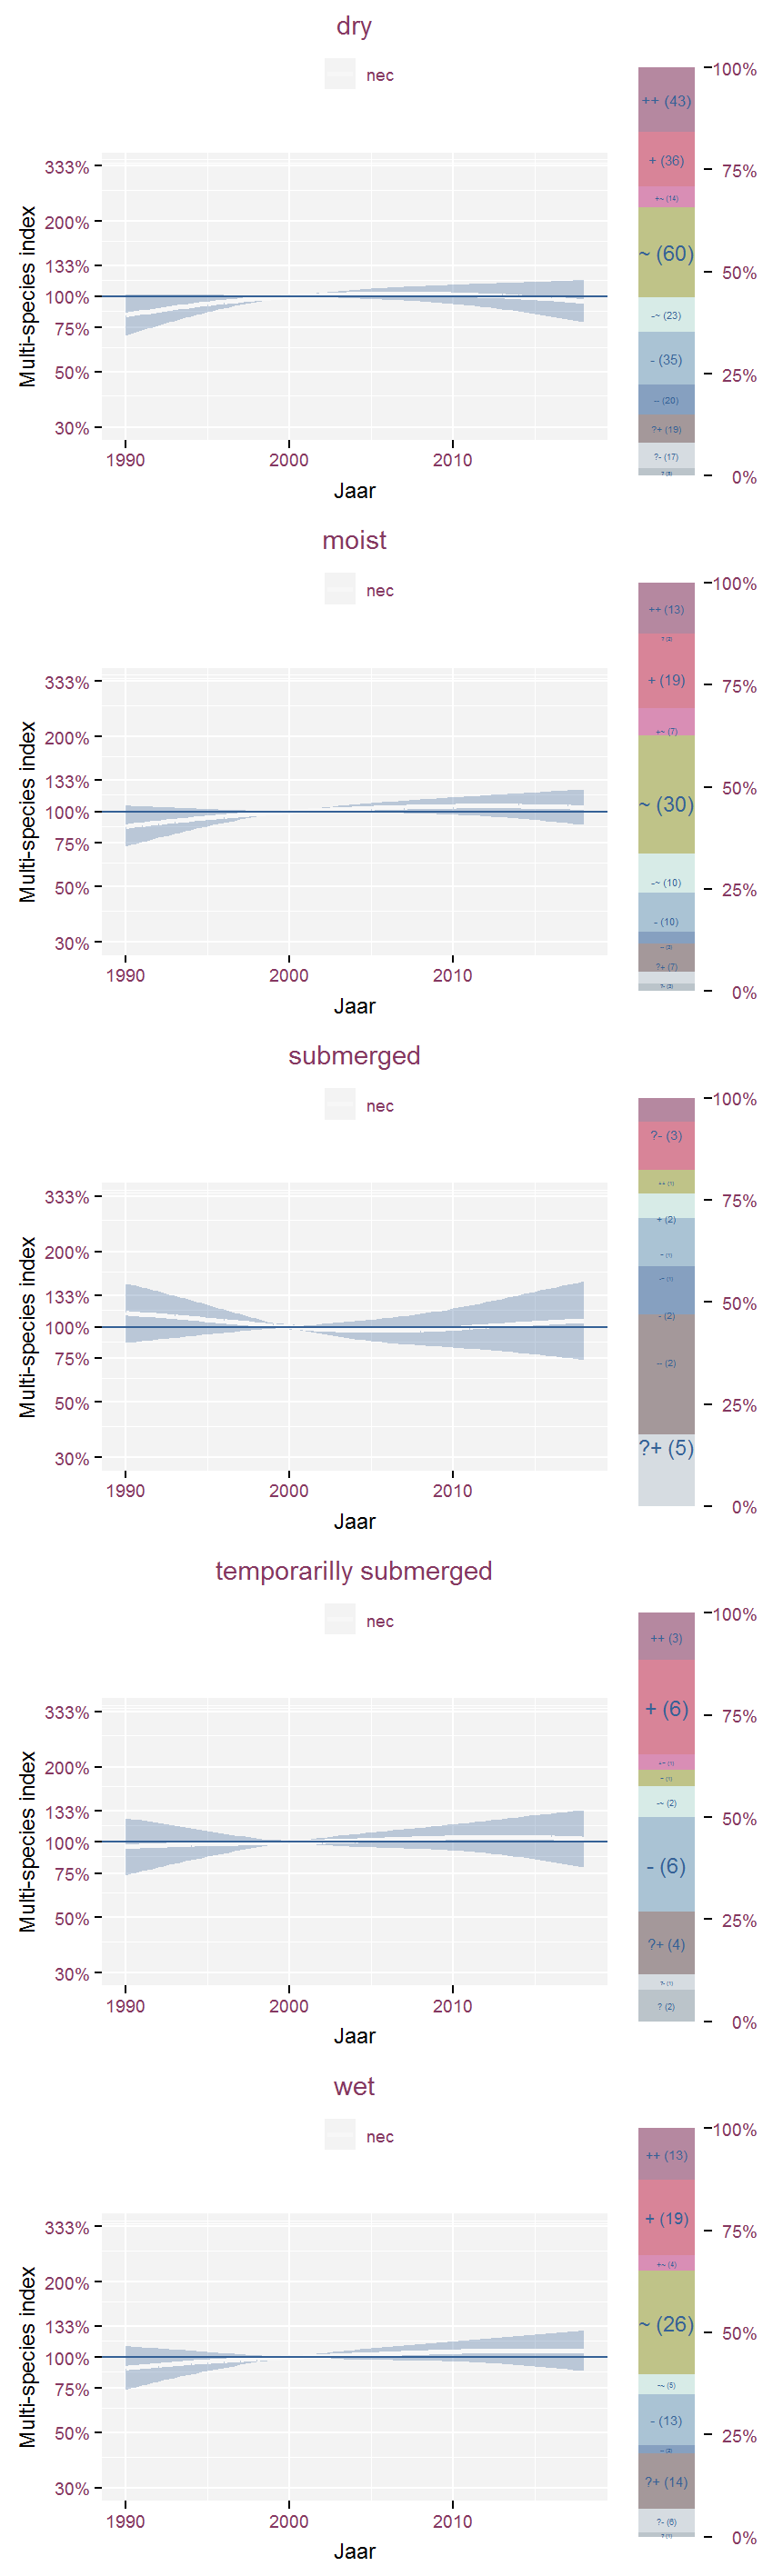
Figure 3.101: Multi-species index for species groups determined by Ellenberg humidity value (regrouped) and period 1990-2018. The index uses 2000 as baseline year.

Multi-species index for Ellenberg humidity value (regrouped) and period 1990-2018. The index uses 2000 as baseline year and Ellenberg ordinal values as weights.

Figure 3.102: )Multi-species index for Ellenberg humidity value (regrouped) and period 1990-2018. The index uses 2000 as baseline year and Ellenberg ordinal values as weights.

Table 3.92: Corresponding list of species for Ellenberg humidity value (regrouped) together with their effect classification for the final year compared to 1990.

3.4.6 substrate (Runhaar et al. 2004)

Multi-species index for species groups determined by substrate (Runhaar et al. 2004) and period 1950-2018. The index uses 2000 as baseline year.

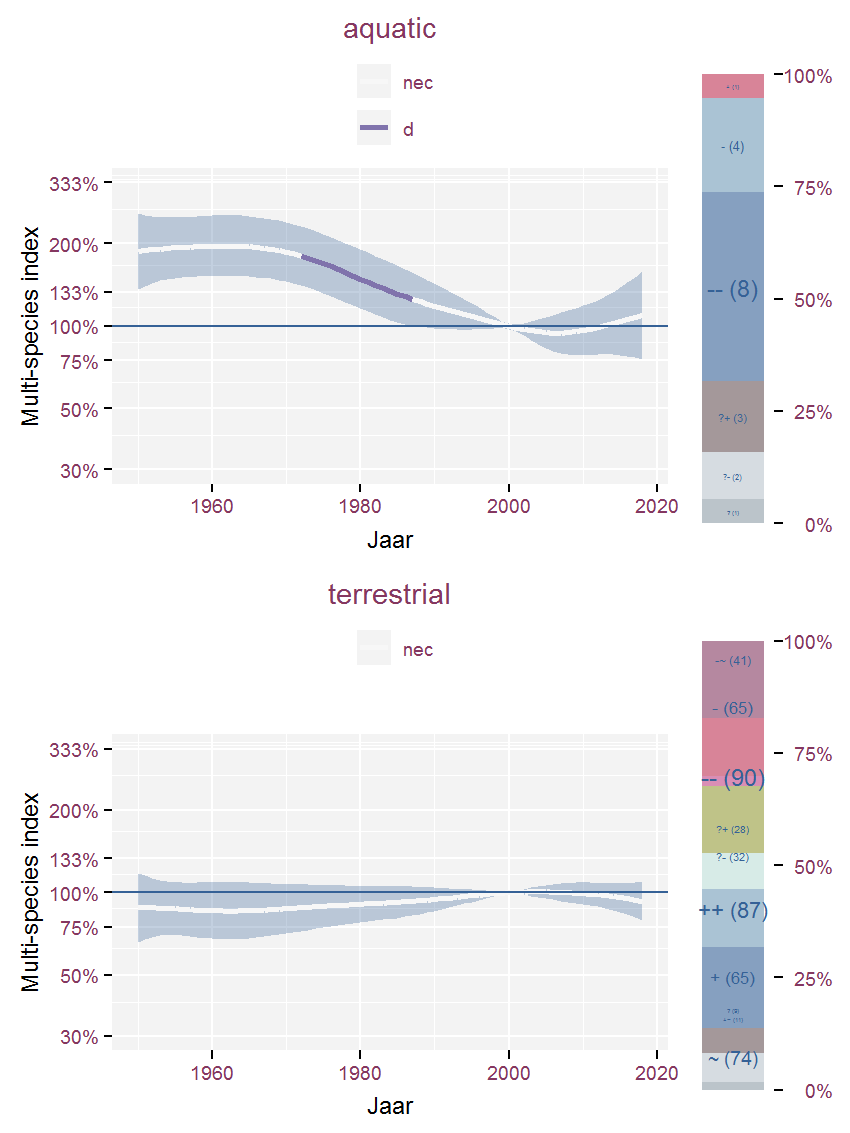
Figure 3.103: Multi-species index for species groups determined by substrate (Runhaar et al. 2004) and period 1950-2018. The index uses 2000 as baseline year.

Table 3.93: Corresponding list of species for substrate (Runhaar et al. 2004) together with their effect classification for the final year compared to 1950.
Multi-species index for species groups determined by substrate (Runhaar et al. 2004) and period 1990-2018. The index uses 2000 as baseline year.

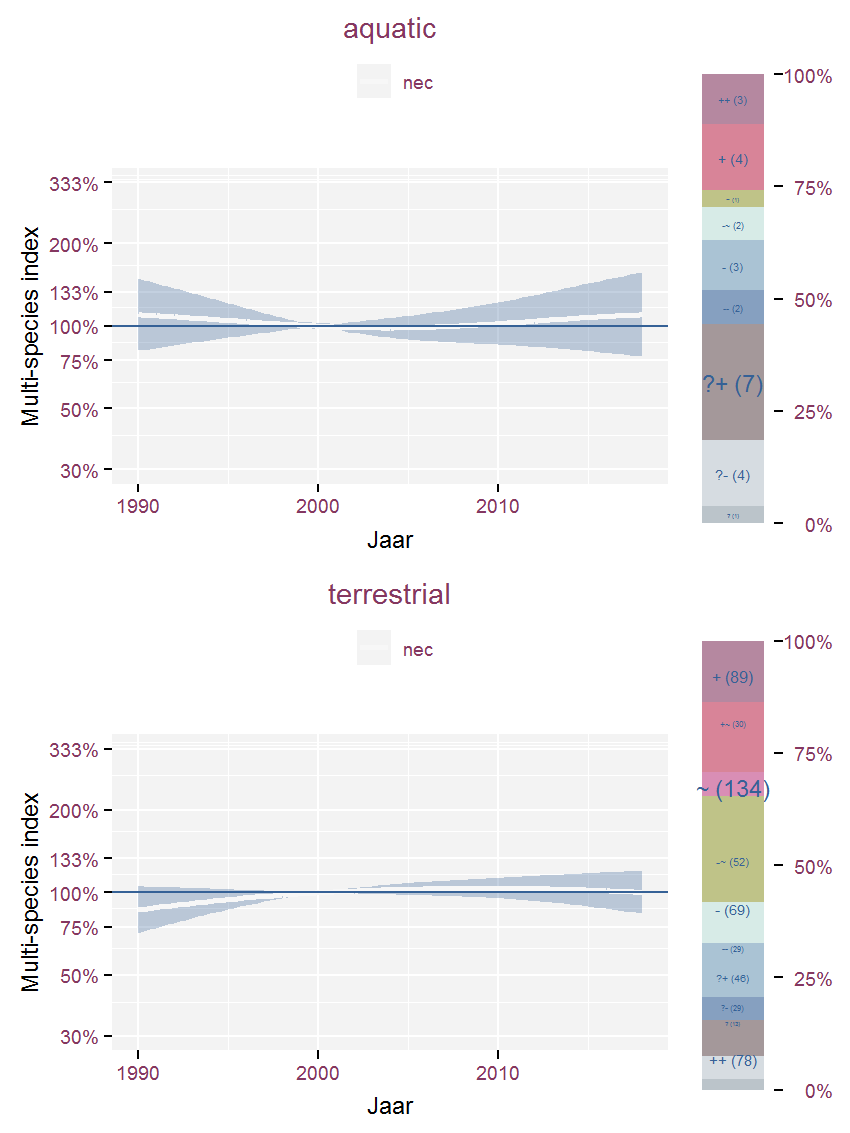
Figure 3.104: Multi-species index for species groups determined by substrate (Runhaar et al. 2004) and period 1990-2018. The index uses 2000 as baseline year.

Table 3.94: Corresponding list of species for substrate (Runhaar et al. 2004) together with their effect classification for the final year compared to 1990.

3.4.7 CSR ordinate values

Multi-species index for species groups determined by CSR ordinate values and period 1950-2018. The index uses 2000 as baseline year.

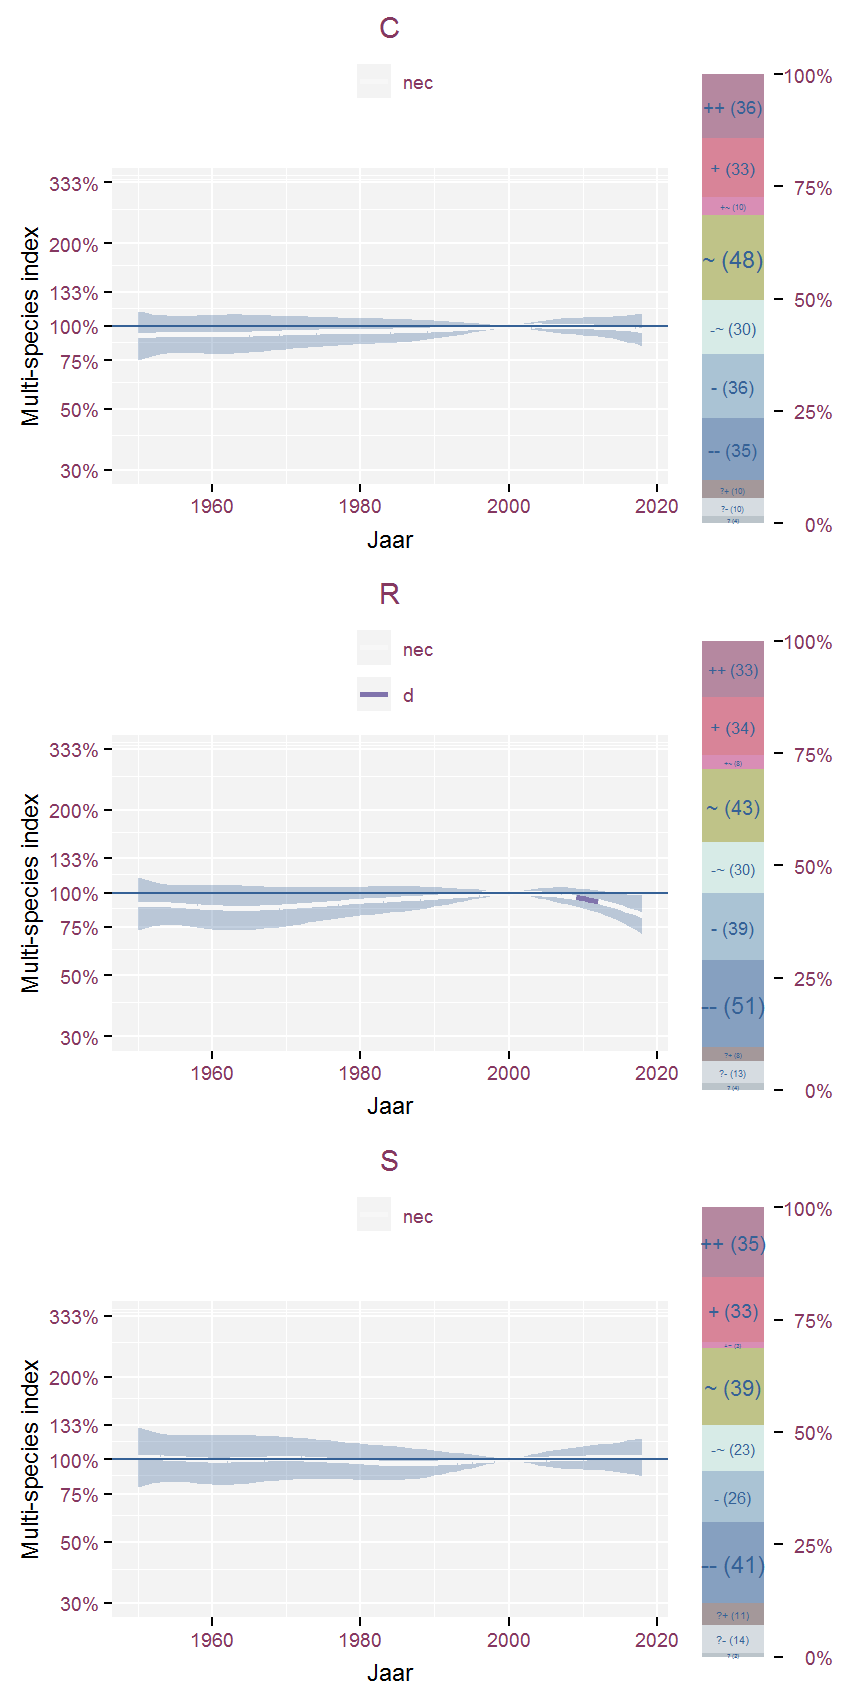
Figure 3.105: Multi-species index for species groups determined by CSR ordinate values and period 1950-2018. The index uses 2000 as baseline year.

Table 3.95: Corresponding list of species for CSR ordinate values together with their effect classification for the final year compared to 1950.
Multi-species index for species groups determined by CSR ordinate values and period 1990-2018. The index uses 2000 as baseline year.

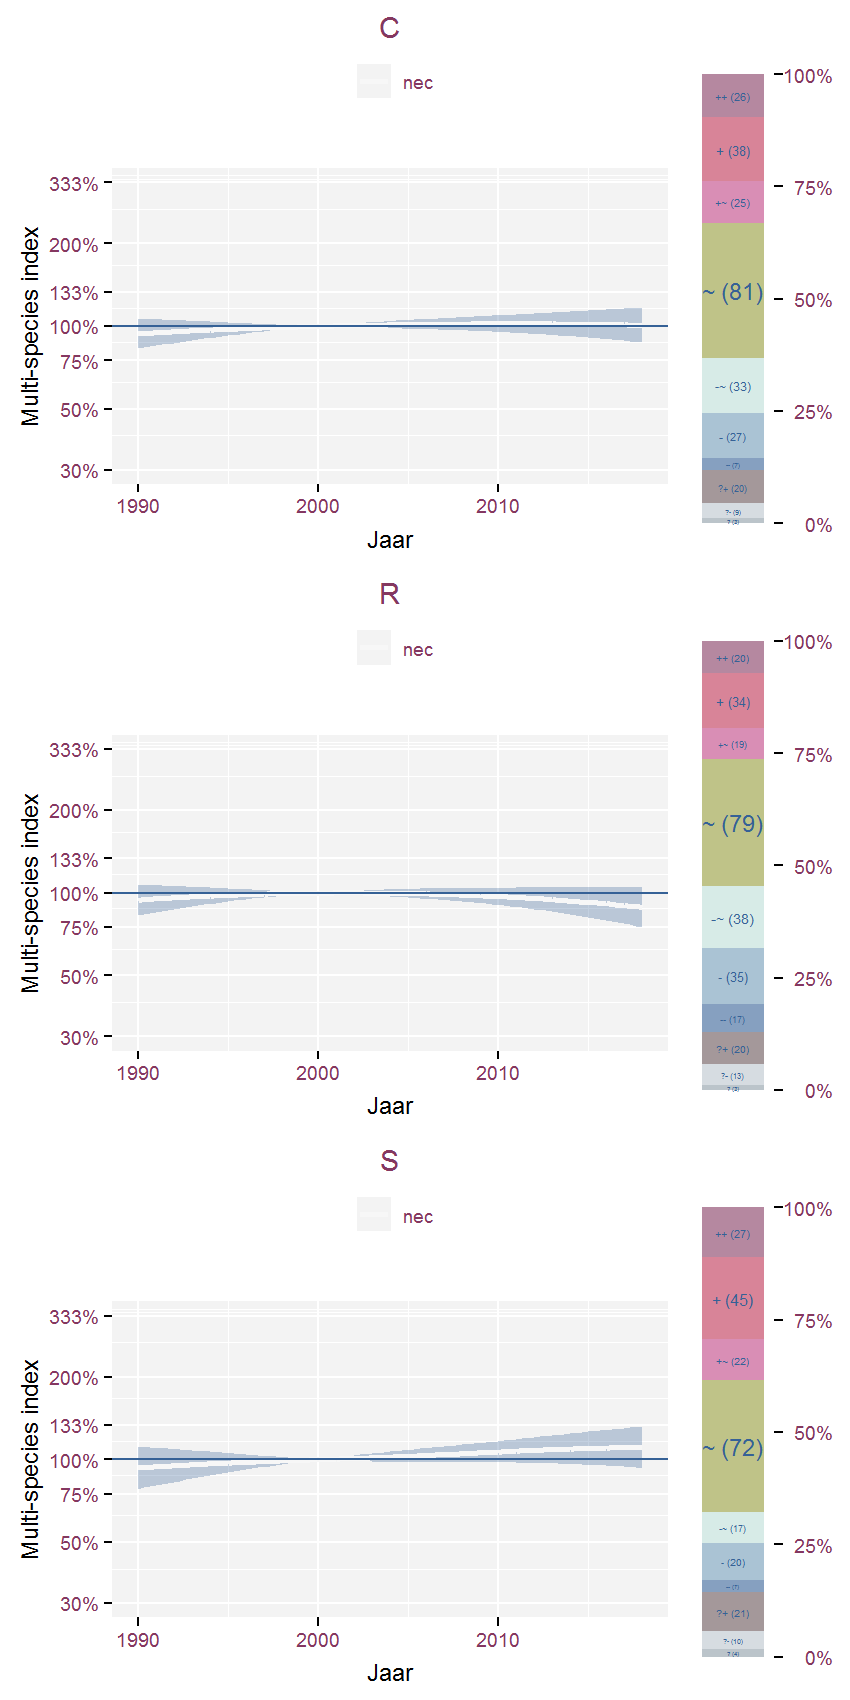
Figure 3.106: Multi-species index for species groups determined by CSR ordinate values and period 1990-2018. The index uses 2000 as baseline year.

Table 3.96: Corresponding list of species for CSR ordinate values together with their effect classification for the final year compared to 1990.

3.5 Other species attributes

3.5.1 chromosome polyploidy

Multi-species index for species groups determined by chromosome polyploidy and period 1950-2018. The index uses 2000 as baseline year.

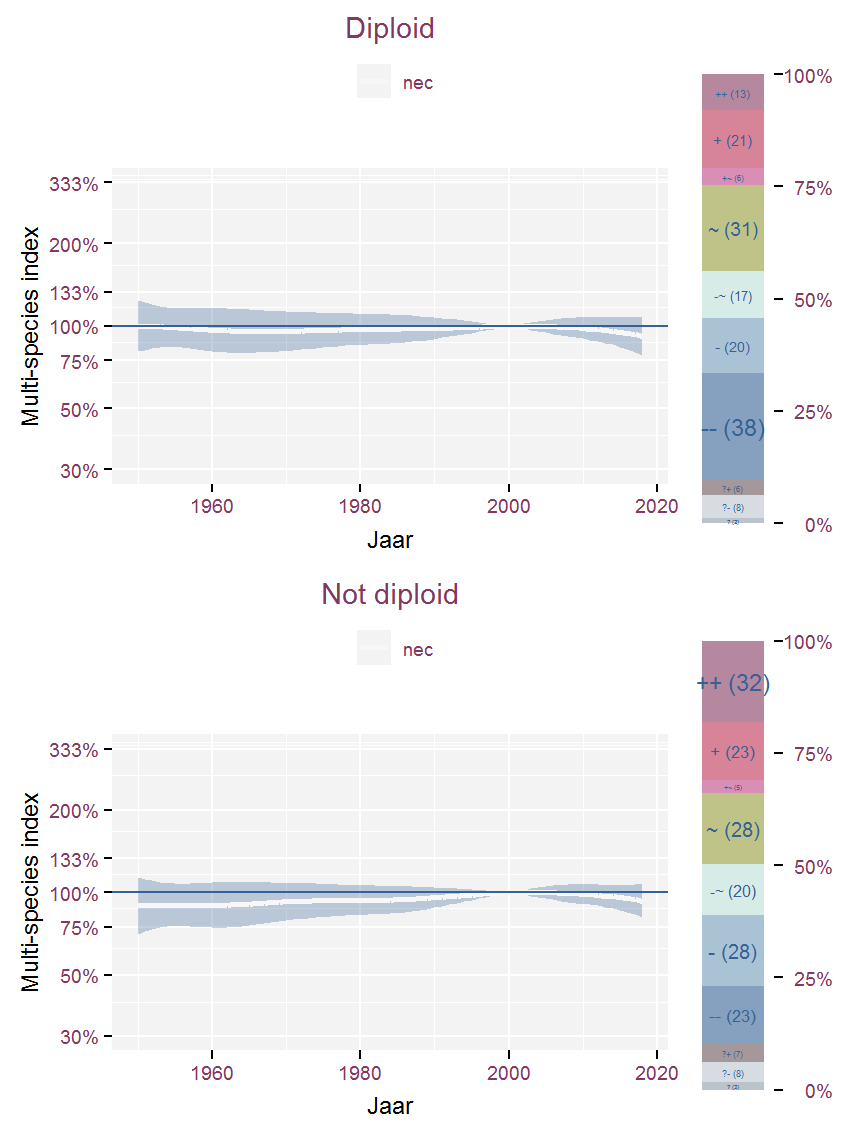
Figure 3.107: Multi-species index for species groups determined by chromosome polyploidy and period 1950-2018. The index uses 2000 as baseline year.

Table 3.97: Corresponding list of species for chromosome polyploidy together with their effect classification for the final year compared to 1950.
Multi-species index for species groups determined by chromosome polyploidy and period 1990-2018. The index uses 2000 as baseline year.

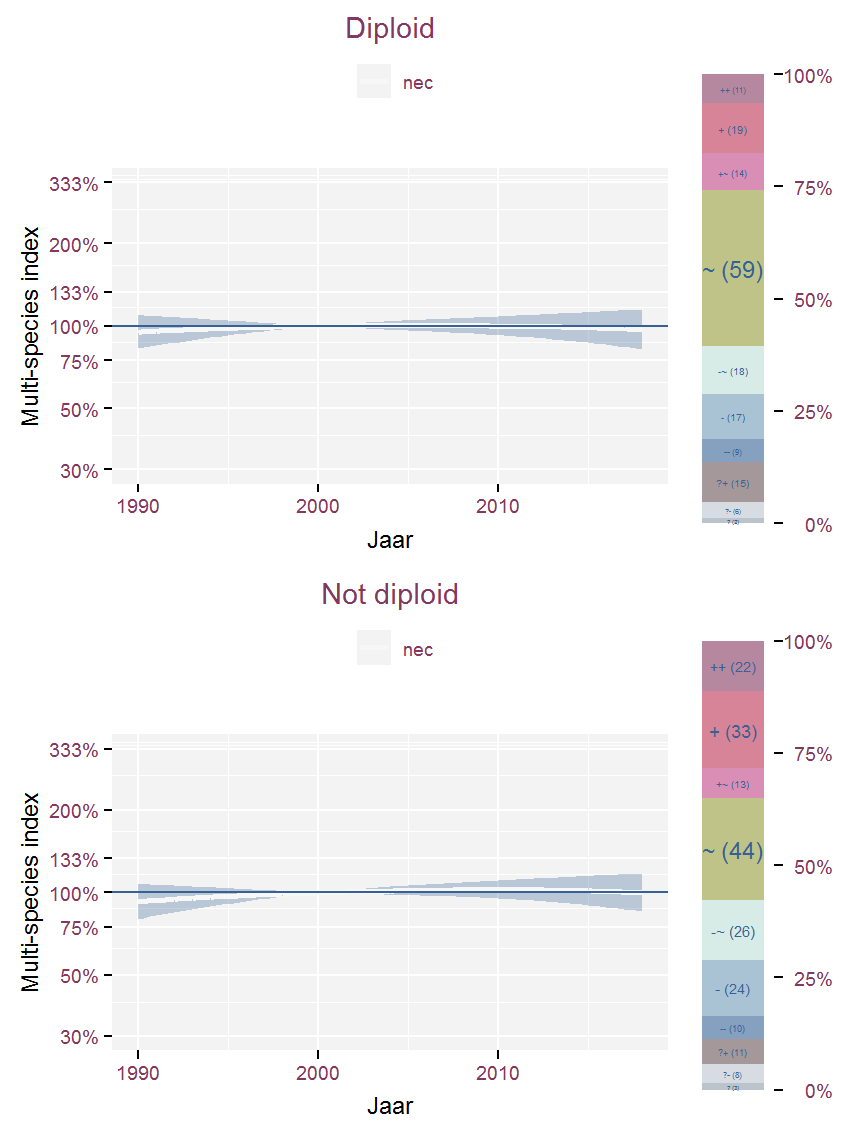
Figure 3.108: Multi-species index for species groups determined by chromosome polyploidy and period 1990-2018. The index uses 2000 as baseline year.

Table 3.98: Corresponding list of species for chromosome polyploidy together with their effect classification for the final year compared to 1990.

3.5.2 ecological amplitude

Multi-species index for species groups determined by ecological amplitude and period 1950-2018. The index uses 2000 as baseline year.

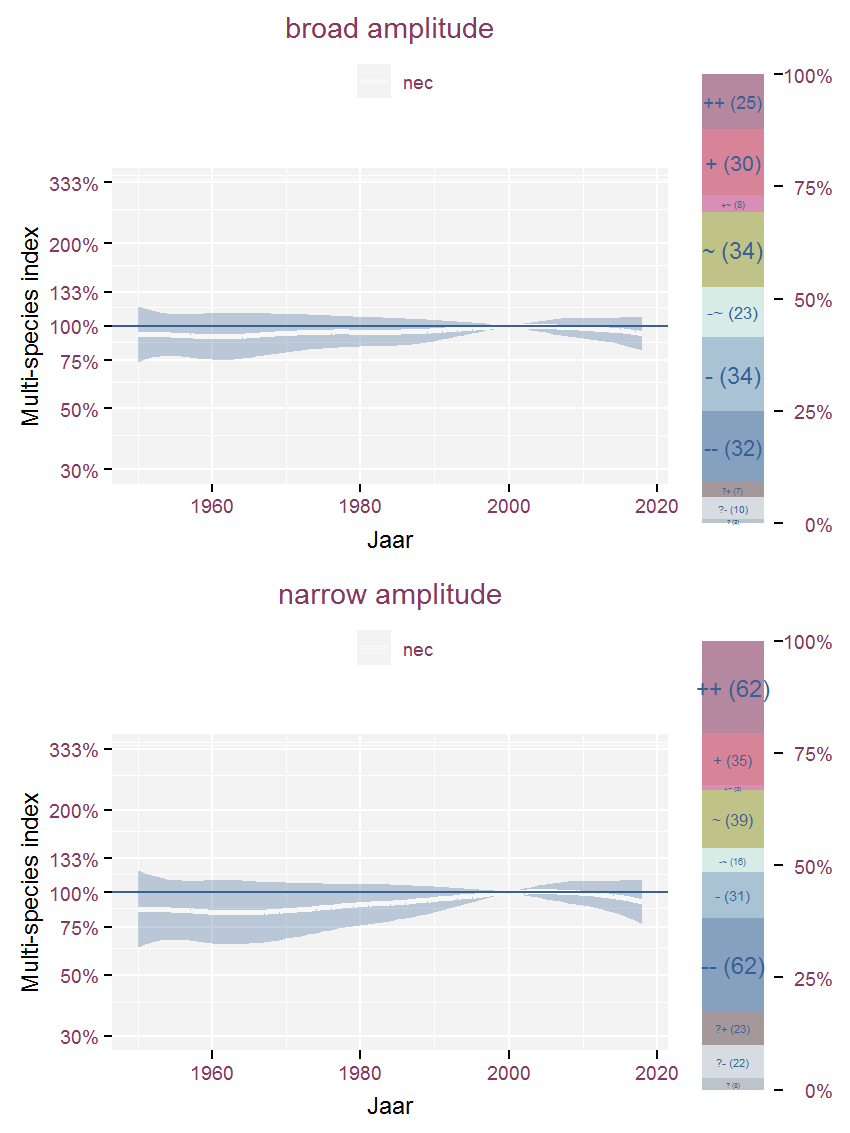
Figure 3.109: Multi-species index for species groups determined by ecological amplitude and period 1950-2018. The index uses 2000 as baseline year.

Table 3.99: Corresponding list of species for ecological amplitude together with their effect classification for the final year compared to 1950.
Multi-species index for species groups determined by ecological amplitude and period 1990-2018. The index uses 2000 as baseline year.

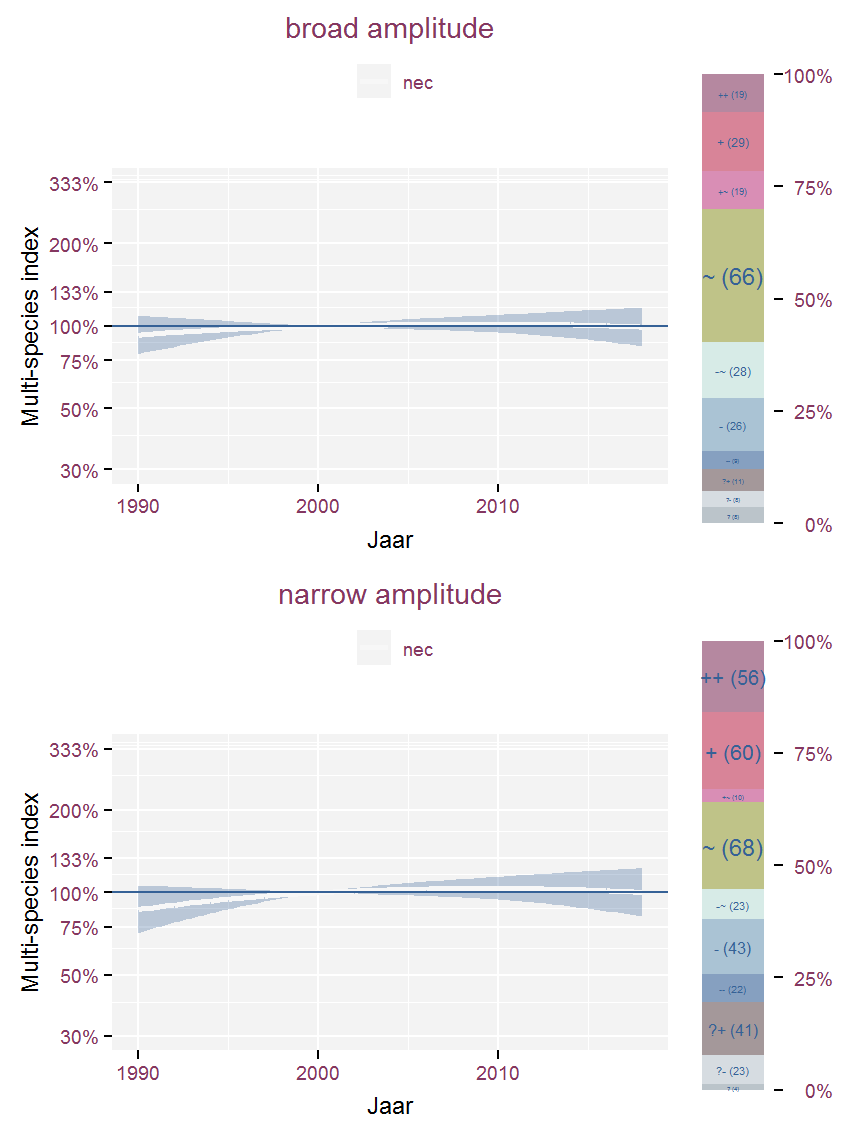
Figure 3.110: Multi-species index for species groups determined by ecological amplitude and period 1990-2018. The index uses 2000 as baseline year.

Table 3.100: Corresponding list of species for ecological amplitude together with their effect classification for the final year compared to 1990.

3.5.3 indigenous, archeophyte or neophyte

Multi-species index for species groups determined by indigenous, archeophyte or neophyte and period 1950-2018. The index uses 2000 as baseline year.

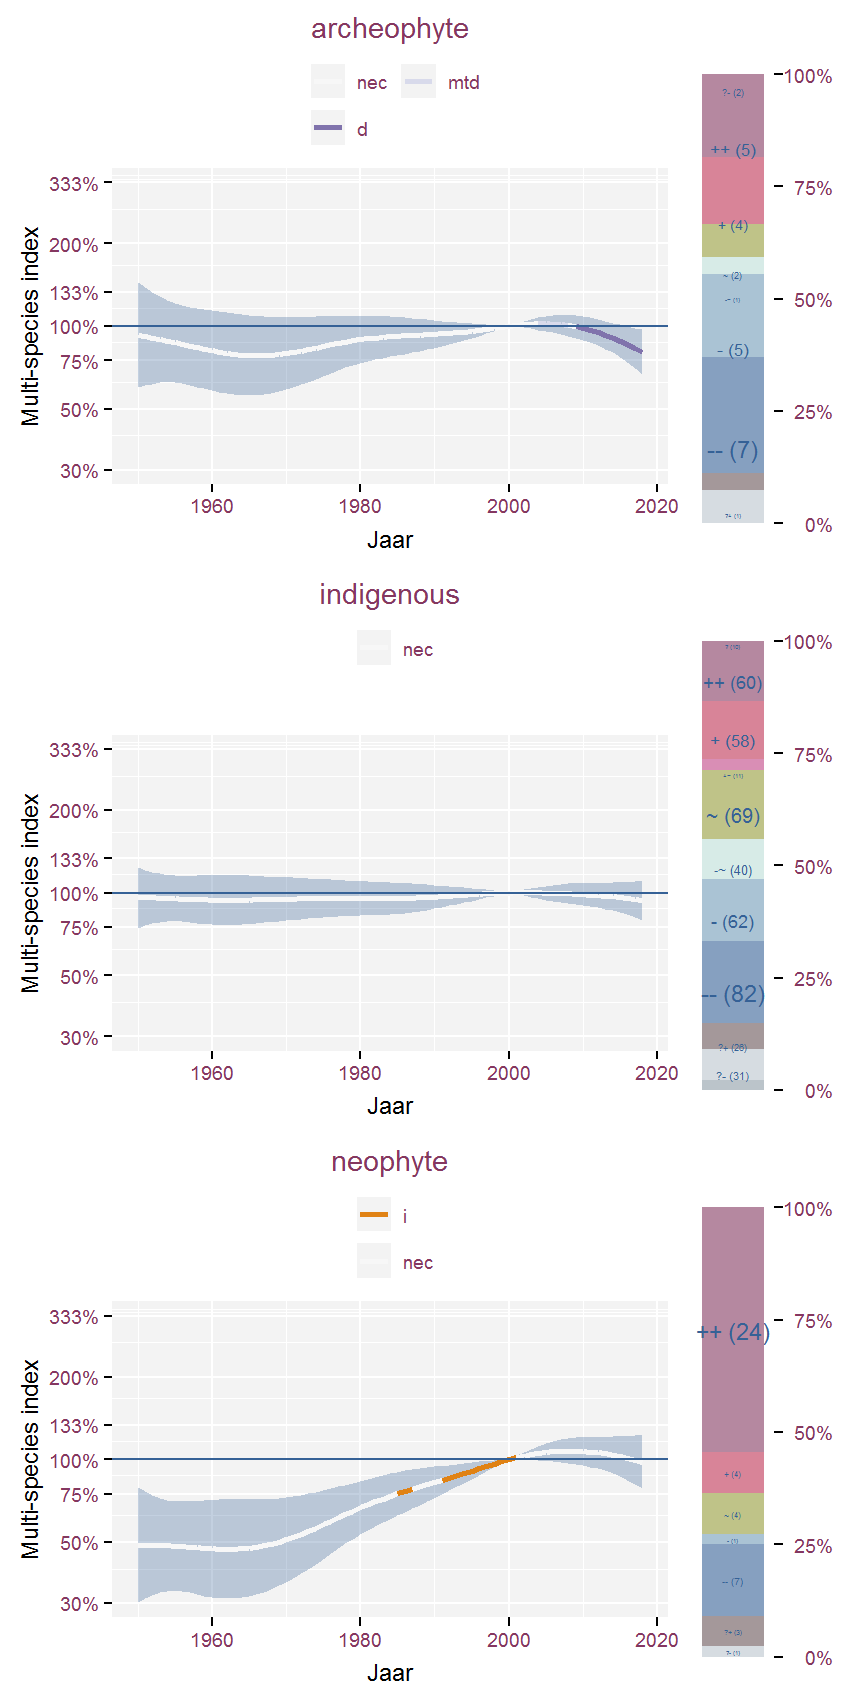
Figure 3.111: Multi-species index for species groups determined by indigenous, archeophyte or neophyte and period 1950-2018. The index uses 2000 as baseline year.

Table 3.101: Corresponding list of species for indigenous, archeophyte or neophyte together with their effect classification for the final year compared to 1950.
Multi-species index for species groups determined by indigenous, archeophyte or neophyte and period 1990-2018. The index uses 2000 as baseline year.

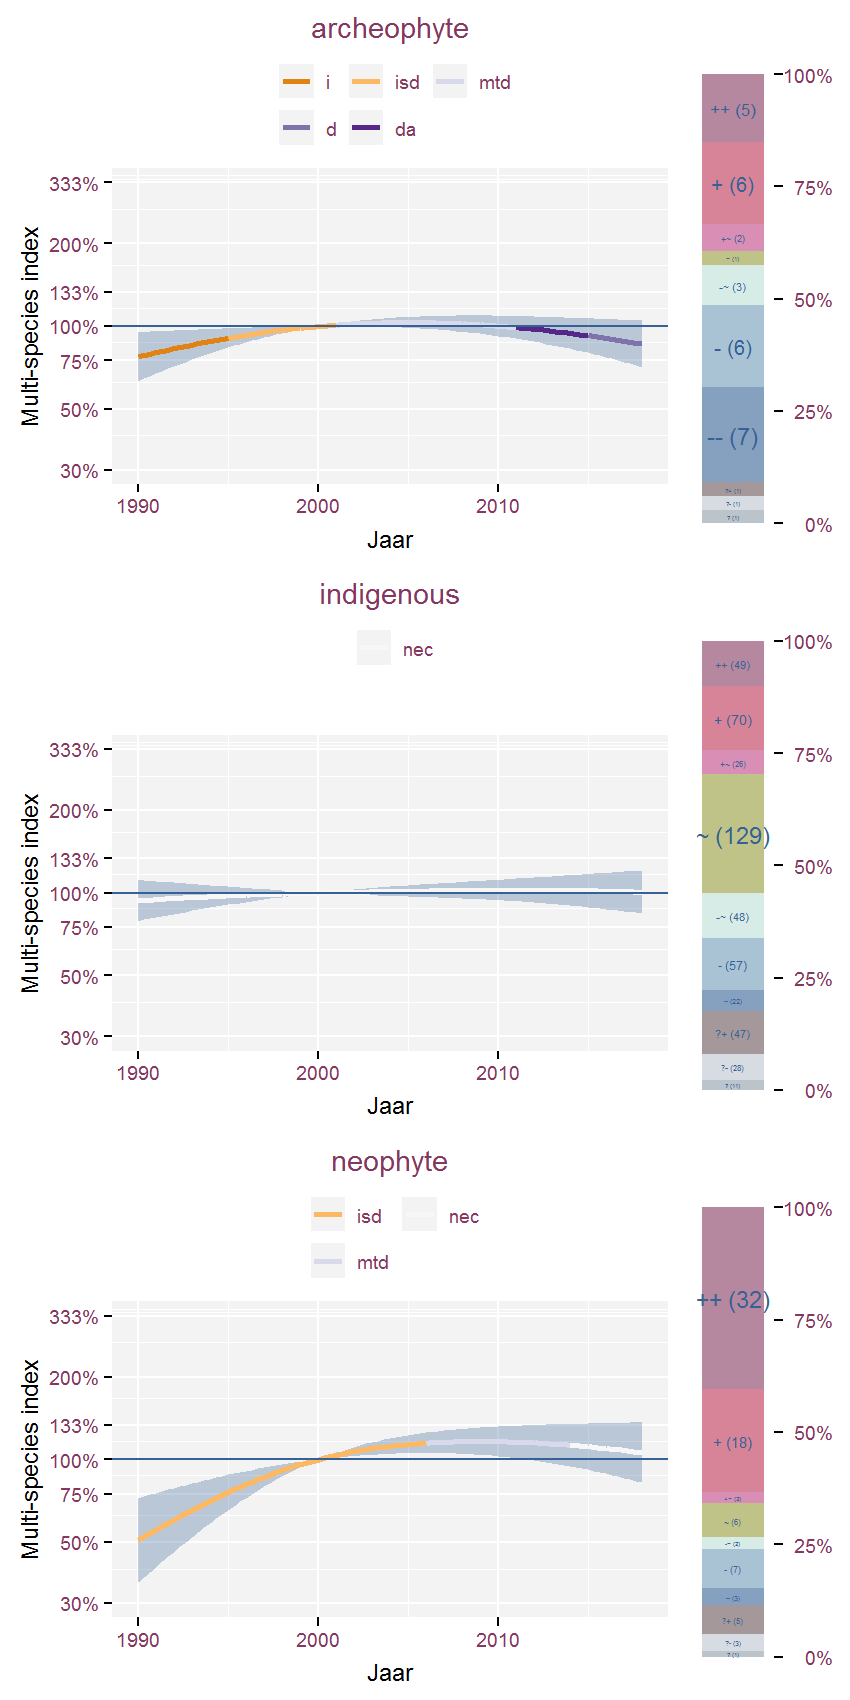
Figure 3.112: Multi-species index for species groups determined by indigenous, archeophyte or neophyte and period 1990-2018. The index uses 2000 as baseline year.

Table 3.102: Corresponding list of species for indigenous, archeophyte or neophyte together with their effect classification for the final year compared to 1990.