Flooding module
Niche Vlaanderen also contains a module to model the influence of flooding more precisely. This is done using the Flooding class.
The first step is importing the niche_vlaanderen module. For convenience, we will be importing as nv.
[1]:
from pathlib import Path
import niche_vlaanderen as nv

%matplotlib inline
import matplotlib.pyplot as plt
Creating a Flooding model
Here the Flooding class is created. Like in Niche Vlaanderen, when creating the class, the model with its codetables is initialized.
[2]:
fp = nv.Flooding()
Running the model
The calculate method of the class takes four arguments: the depths (as grid), frequency, period and duration.
[3]:
fp.calculate("../testcase/flooding/ff_bt_t10_h_0.asc", frequency="T10", period="summer", duration=1)
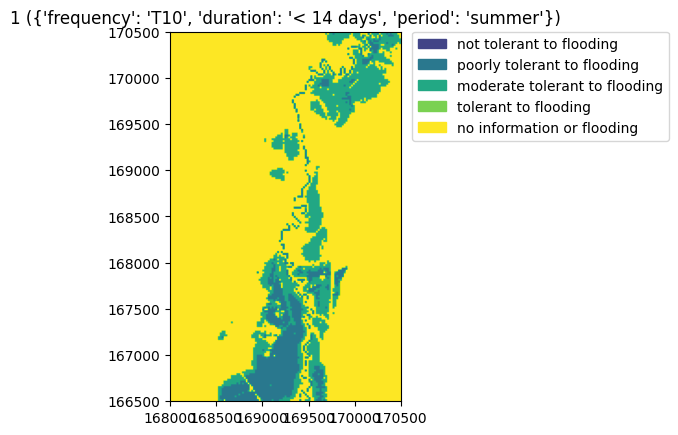
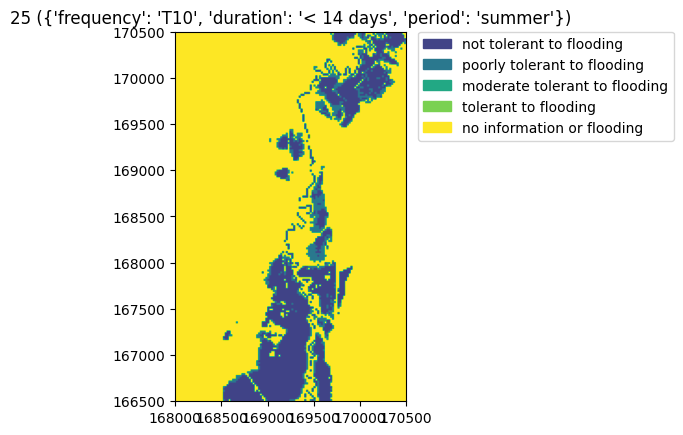
Inspecting the model
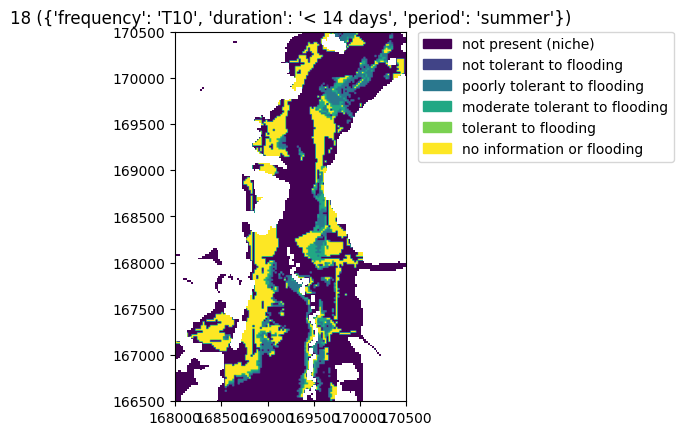
The results can be plotted per vegetation type. Note that not all vegetation types of Niche are supported by the flooding module.
[4]:
fp.plot(1)
fp.plot(25)

plt.show()
Like for the niche model, it is also possible to generate a summary table.
[5]:
fp.table.head()
[5]:
| vegetation | presence_code | presence | area_ha | |
|---|---|---|---|---|
| 0 | 1 | 4 | no information or flooding | 821.36 |
| 1 | 1 | 2 | moderate tolerant to flooding | 110.92 |
| 2 | 1 | 1 | poorly tolerant to flooding | 67.72 |
| 3 | 2 | 4 | no information or flooding | 821.36 |
| 4 | 2 | 2 | moderate tolerant to flooding | 110.92 |
Saving the model
Comparable to the niche model, the resulting grids can be saved using the write method.
[6]:
fp.write("_output", overwrite_files=True)
Combining the output with niche
The output of a Flooding model can be combined with a Niche model, by using the combine method.
We will create a new niche model and set the inputs.
[7]:
myniche = nv.Niche()
input_folder = Path("../testcase/dijle/")
myniche.set_input("soil_code", input_folder / "bodemv.asc")
myniche.set_input("msw", input_folder / "gvg_0_cm.asc")
myniche.set_input("mlw", input_folder / "glg_0_cm.asc")
myniche.set_input("mhw", input_folder / "ghg_0_cm.asc")
myniche.set_input("seepage", input_folder / "kwel_mm_dag.asc")
myniche.set_input("management", input_folder / "beheer_int.asc")

myniche.set_input("nitrogen_atmospheric", input_folder / "depositie_def.asc")
myniche.set_input("nitrogen_animal", input_folder / "bemest_dier.asc")
myniche.set_input("nitrogen_fertilizer", input_folder / "bemest_kunst.asc")

myniche.set_input("inundation_vegetation", input_folder / "overstr_veg.asc")
myniche.set_input("inundation_acidity", input_folder / "ovrstr_t10_50.asc")
myniche.set_input("inundation_nutrient", input_folder / "ovrstr_t10_50.asc")

myniche.set_input("minerality", input_folder / "minerality.asc")
myniche.set_input("rainwater", input_folder / "nulgrid.asc")
Note that the niche model must be run prior to combining - otherwise this will raise an error.
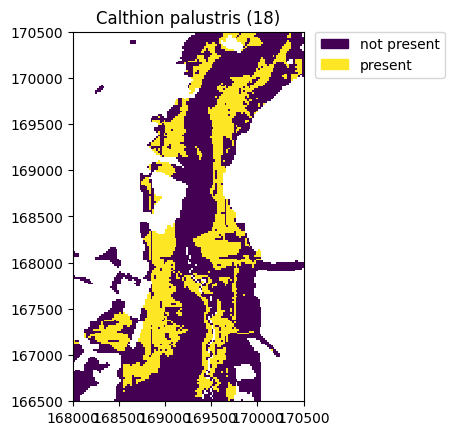
In this example we also plot the result to allow comparison with the combined map.
[8]:
myniche.run()
[9]:
myniche.plot(18)
plt.show()
Finally, we run the actual combine method. The resulting object is a Flooding object, so we can use the same method for plotting the results.
[10]:
combined = fp.combine(myniche)
combined.plot(18)
plt.show()