'Zoom in' on `ggplot2` figures
Learn the difference between zooming in with scales and coordinates.
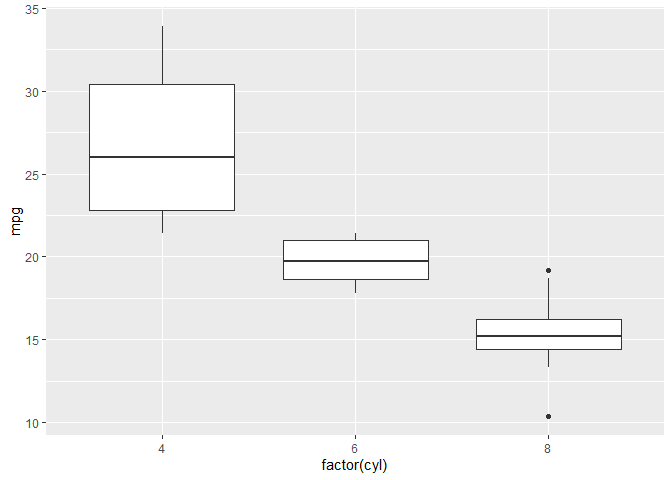
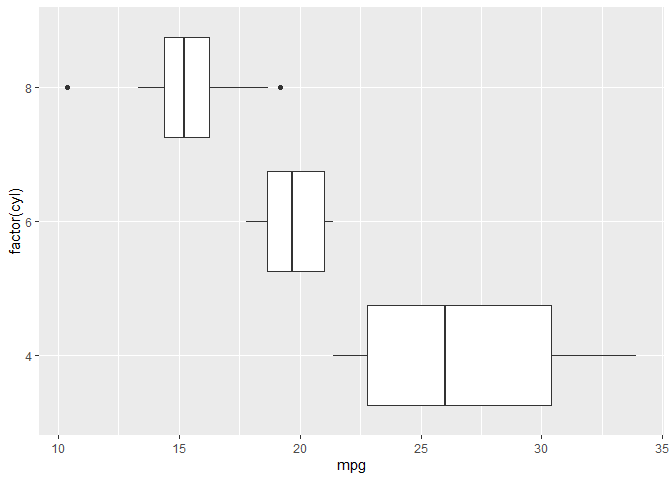
Original figure
library(ggplot2)
ggplot(mtcars, aes(x = factor(cyl), y = mpg)) +
  geom_boxplot()
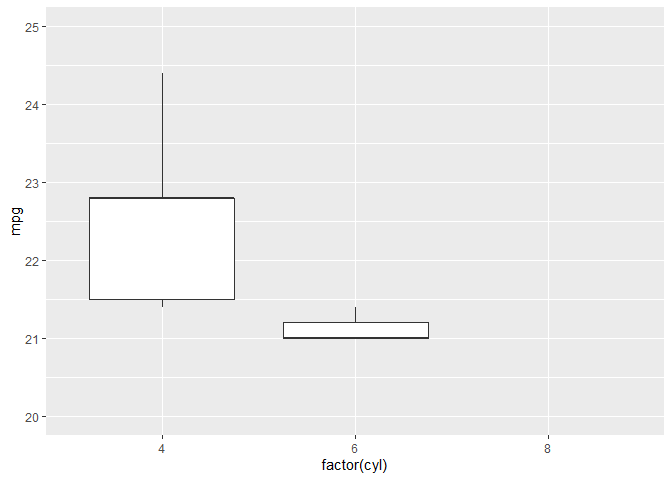
“Zoom in” with scales
Data points outside the limits are considered to be NA. Note that this
will alter all calculated geoms.
ggplot(mtcars, aes(x = factor(cyl), y = mpg)) +
  geom_boxplot() +
  scale_y_continuous(limits = c(20, 25))
## Warning: Removed 24 rows containing non-finite values (stat_boxplot).
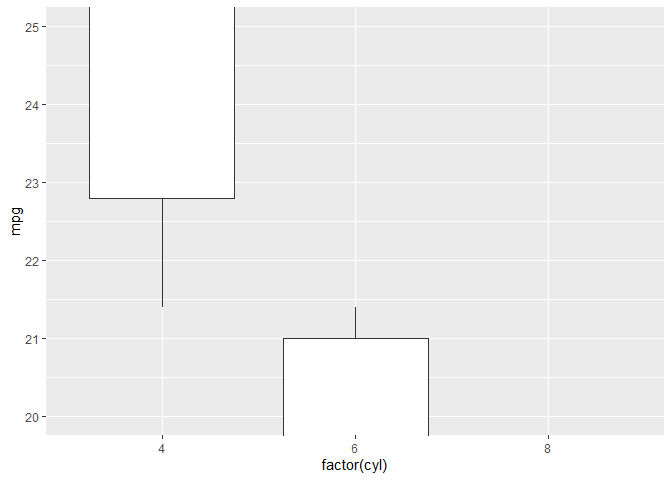
“Zoom in” with coord
This doesn’t affect the values:
ggplot(mtcars, aes(x = factor(cyl), y = mpg)) +
  geom_boxplot() +
  coord_cartesian(ylim = c(20, 25))
Note that you can use only one coord. Only the last one will have an
effect on the plot.
ggplot(mtcars, aes(x = factor(cyl), y = mpg)) +
  geom_boxplot() +
  coord_cartesian(ylim = c(20, 25)) +
  coord_flip()
## Coordinate system already present. Adding new coordinate system, which will replace the existing one.
ggplot(mtcars, aes(x = factor(cyl), y = mpg)) +
  geom_boxplot() +
  coord_flip() +
  coord_cartesian(ylim = c(20, 25))
## Coordinate system already present. Adding new coordinate system, which will replace the existing one.

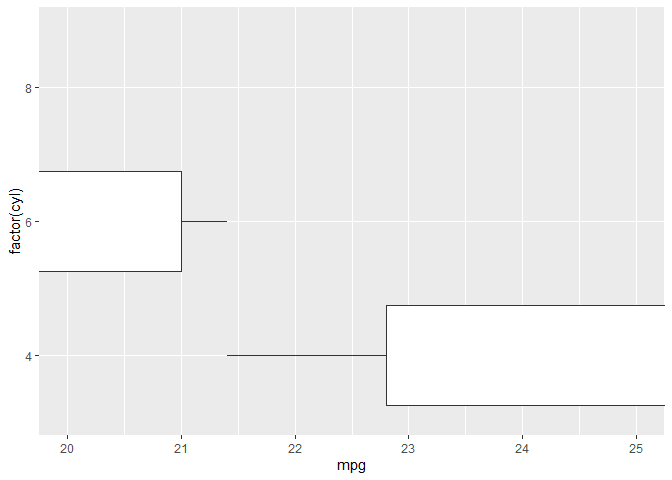
Set the limits in coord_flip to get the effects of both.
ggplot(mtcars, aes(x = factor(cyl), y = mpg)) +
  geom_boxplot() +
  coord_flip(ylim = c(20, 25))