Let's create an interactive map!
Creating interactive maps with leaflet
General note: migration to the more actively developed sf package is
currently advised by the sp maintainer. The sp package, used in
this tutorial, is still maintained in order to support the newest
versions of the GDAL and PROJ backends.
Introduction
The required packages are leaflet and sp.
library(leaflet)
library(sp)
Dummy data
Let’s create a dummy data.frame to play around, i.e. the three
locations of INBO:
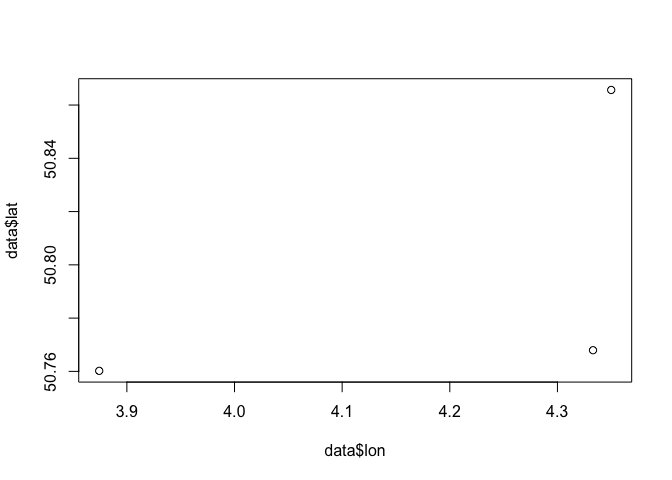
names <- c("VAC HT", "Geraardsbergen", "Linkebeek")
lat <- c(50.865664, 50.760201, 50.767950)
lon <- c(4.349944, 3.874300, 4.333044)
data <- data.frame(names, lat, lon)
We created three points:
plot(data$lon, data$lat)
Creating a map
We need to convert the data.frame to a SpatialPointsDataFrame:
crs_wgs84 <- CRS(SRS_string = "EPSG:4326")
pts <- SpatialPointsDataFrame(data[c("lon","lat")],
                              data[!(names(data) %in% c("lon","lat"))],
                              proj4string = crs_wgs84)
The leaflet package is ideal to create a basic interactive map:
library(leaflet)
leaf_map <-
  leaflet(pts) %>%
  addTiles(group = "OSM") %>%
  addCircleMarkers()
leaf_map
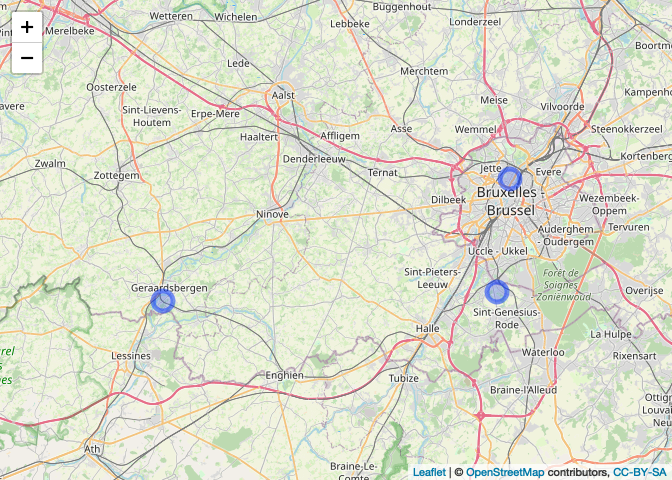
Note: run the code to see the interactive map.
Nice, no?!
More information is provided at the leaflet information website!