A scale for effect points
scale_effect(
  ...,
  detailed = TRUE,
  signed = TRUE,
  fill = TRUE,
  colour = TRUE,
  drop = FALSE,
  labels = class_labels(lang = "en", detailed = detailed, signed = signed)
)
Arguments
- ...
Arguments passed on to
ggplot2::scale_shape_manualvaluesa set of aesthetic values to map data values to. The values will be matched in order (usually alphabetical) with the limits of the scale, or with
breaksif provided. If this is a named vector, then the values will be matched based on the names instead. Data values that don't match will be givenna.value.breaksOne of:
NULLfor no breakswaiver()for the default breaks (the scale limits)A character vector of breaks
A function that takes the limits as input and returns breaks as output
na.valueThe aesthetic value to use for missing (
NA) values
- detailed
TRUEindicates a detailedclassification();FALSEacoarse_classification(). Defaults toTRUE.- signed
TRUEindicates a signed classification;FALSEa classification withremove_sign(). Defaults toTRUE.- fill
return
ggplot2::scale_fill_manual()- colour
- drop
Drop unused levels. This is always
FALSE. Changing this argument has no effect. We provide the argument to avoid errors in case the user sets the argument.- labels
the labels for the legend.
See also
Other ggplot2 add-ons:
stat_effect(),
stat_fan()
Examples
# All possible classes
z <- data.frame(
estimate = c(-0.5, 0, 0.5, 1.5, 1, 0.5, 0, -0.5, -1, -1.5),
sd = c(rep(0.8, 3), rep(0.3, 7))
)
z$lcl <- qnorm(0.05, z$estimate, z$sd)
z$ucl <- qnorm(0.95, z$estimate, z$sd)
classification(z$lcl, z$ucl, threshold = 1) -> z$effect
c(
"?" = "unknown\neffect", "?+" = "potential\npositive\neffect",
"?-" = "potential\nnegative\neffect", "~" = "no effect",
"+" = "positive\neffect", "-" = "negative\neffect",
"+~" = "moderate\npositive\neffect", "-~" = "moderate\nnegative\neffect",
"++" = "strong\npositive\neffect", "--" = "strong\nnegative\neffect"
)[as.character(z$effect)] -> z$x
z$x <- factor(z$x, z$x)
z$display <- paste(
"estimate:", format_ci(z$estimate, lcl = z$lcl, ucl = z$ucl)
)
# Simulated trend
set.seed(20190521)
base_year <- 2000
n_year <- 20
trend <- data.frame(
dt = seq_len(n_year),
change = rnorm(n_year, sd = 0.2),
sd = rnorm(n_year, mean = 0.1, sd = 0.01)
)
trend$index <- cumsum(trend$change)
trend$lcl <- qnorm(0.025, trend$index, trend$sd)
trend$ucl <- qnorm(0.975, trend$index, trend$sd)
trend$year <- base_year + trend$dt
trend$display <- paste(
"index:", format_ci(trend$index, lcl = trend$lcl, ucl = trend$ucl)
)
th <- 0.25
ref <- 0
oldw <- getOption("warn")
options(warn = -1)
library(ggplot2)
theme_set(theme_grey(base_family = "Helvetica"))
update_geom_defaults("point", list(size = 5))
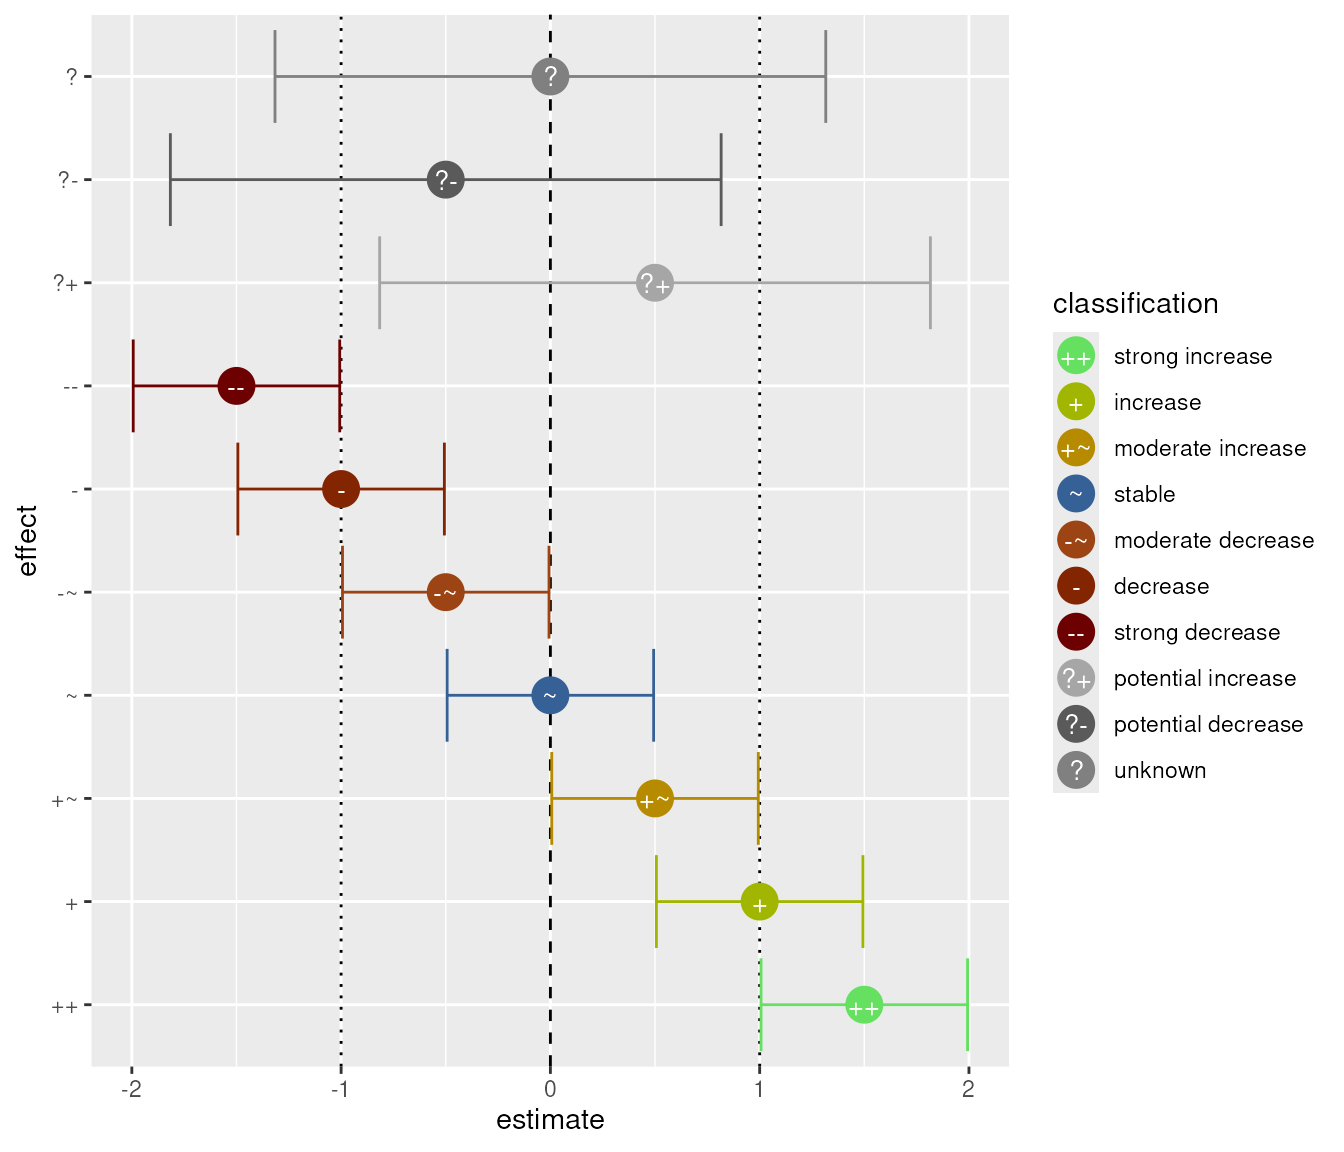
ggplot(z, aes(x = effect, y = estimate, ymin = lcl, ymax = ucl)) +
stat_effect(threshold = 1) +
coord_flip()
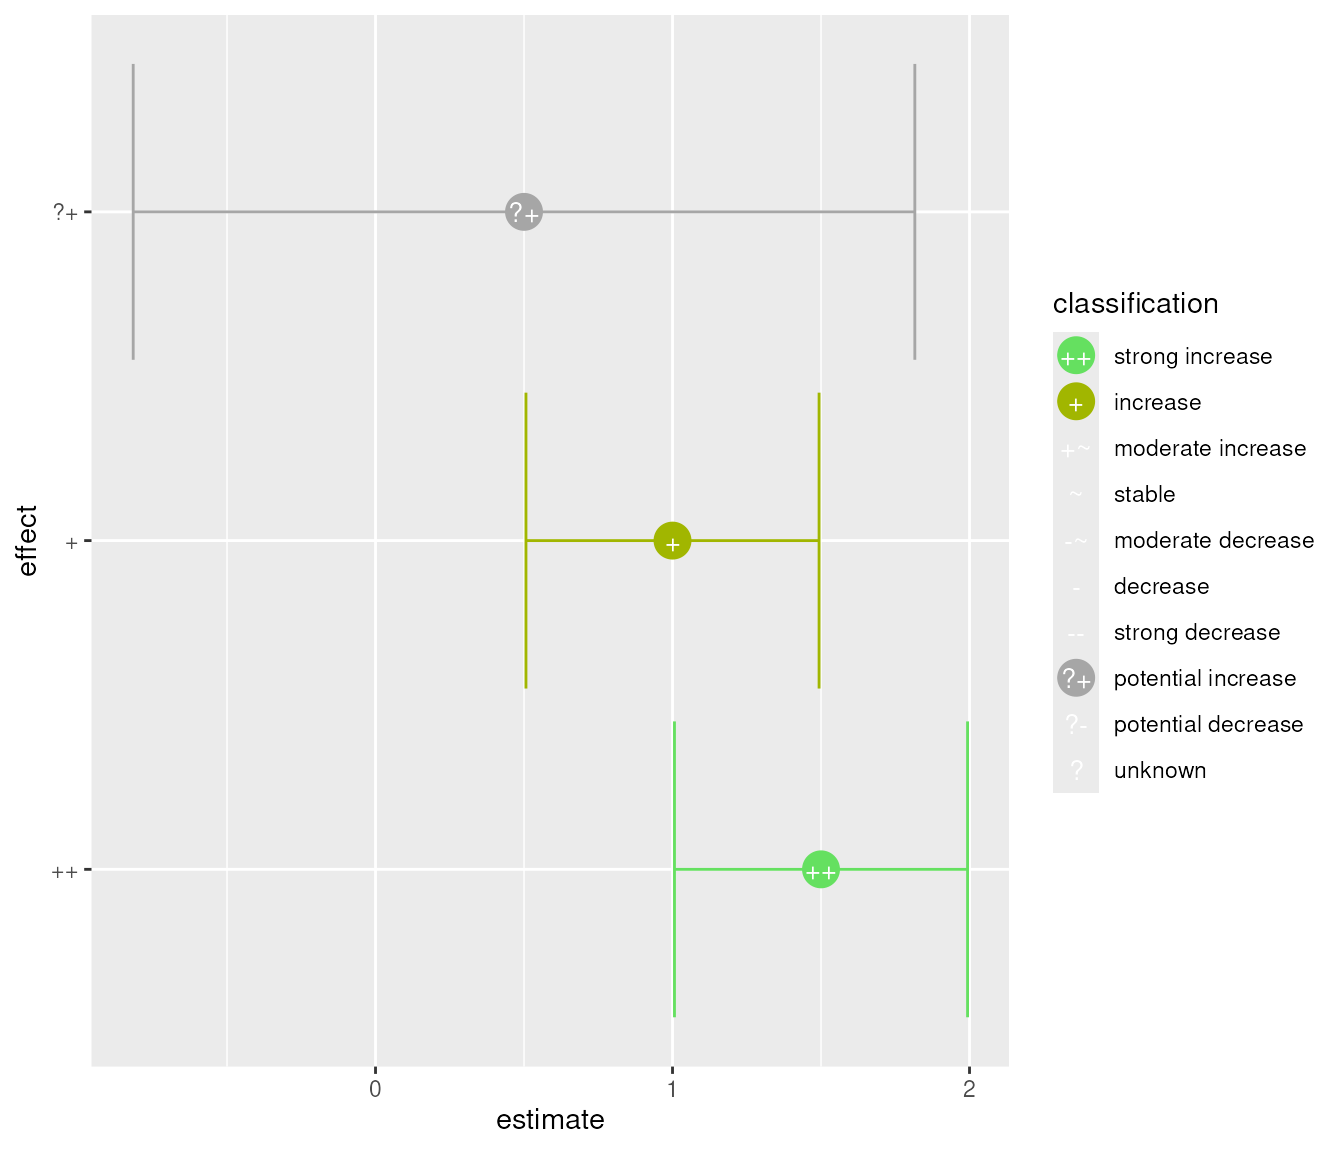
 ggplot(z[3:5, ], aes(x = effect, y = estimate, ymin = lcl, ymax = ucl)) +
stat_effect(threshold = 1, ref_line = "none") +
coord_flip()
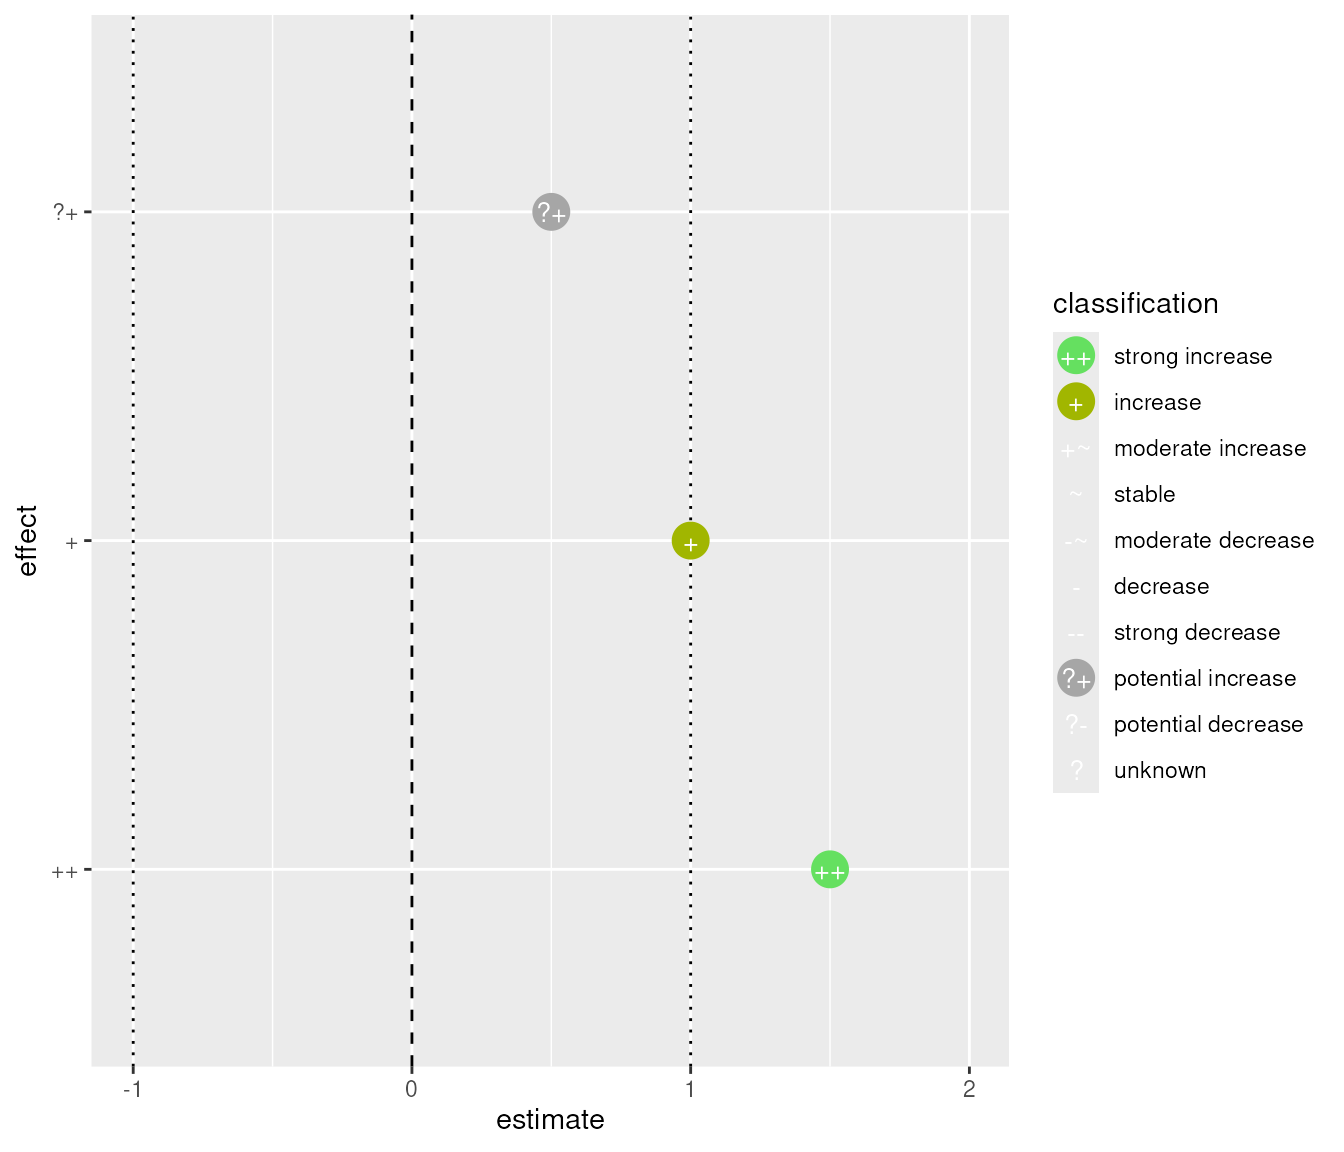
 ggplot(z[3:5, ], aes(x = effect, y = estimate, ymin = lcl, ymax = ucl)) +
stat_effect(threshold = 1, errorbar = FALSE) +
coord_flip()
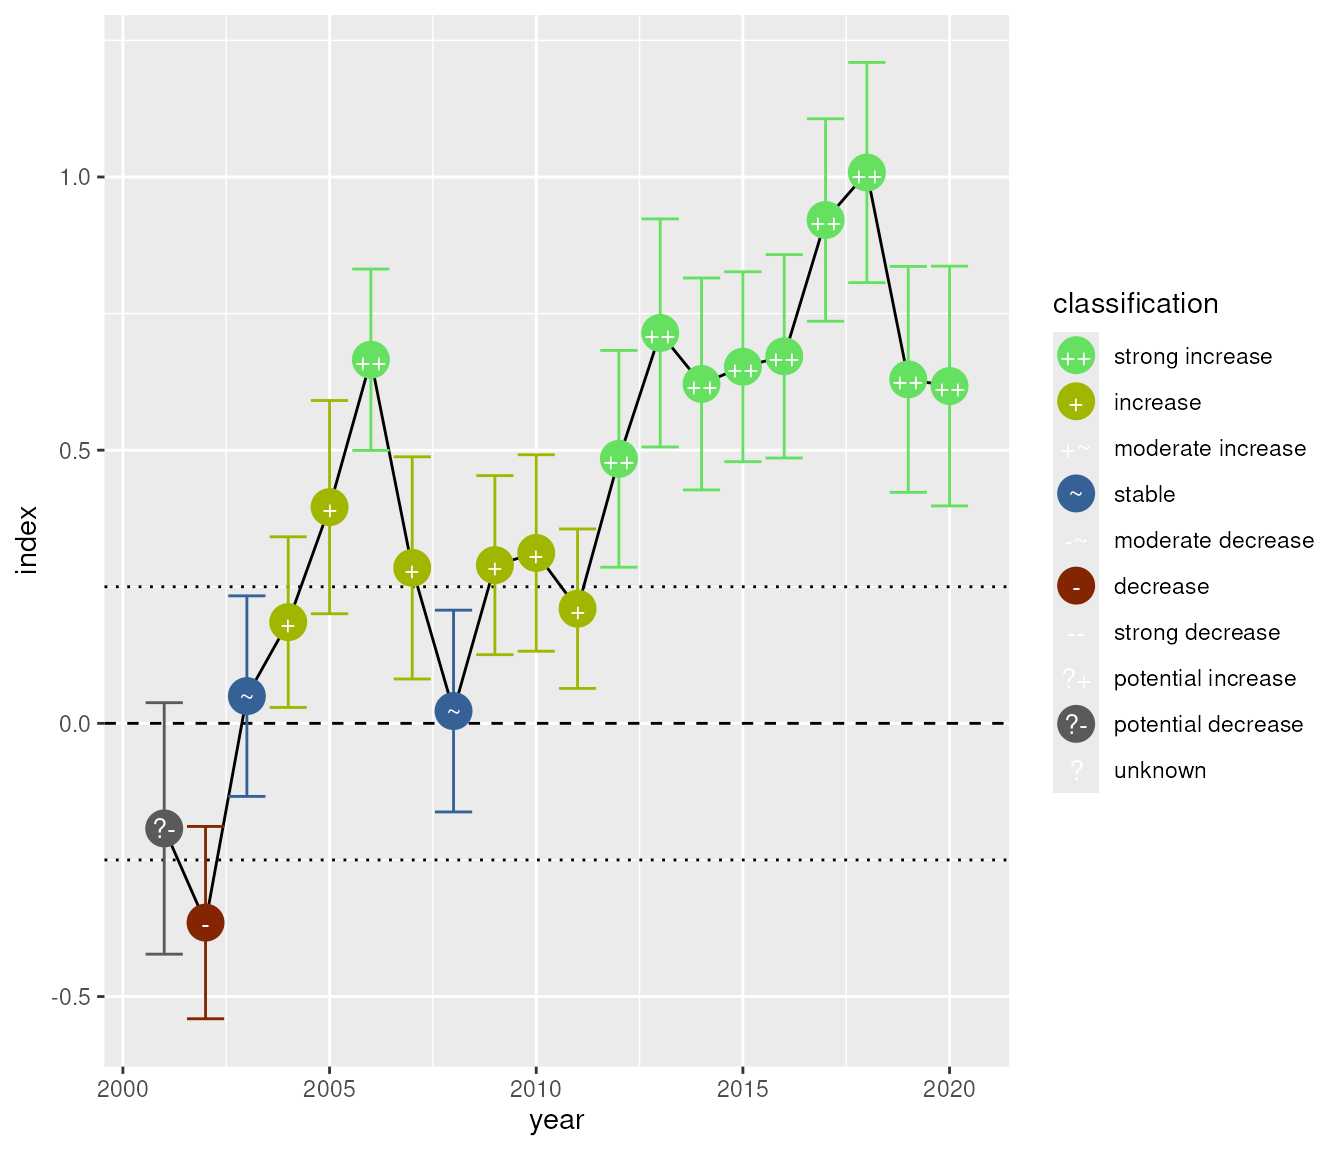
 # plot indices
ggplot(trend, aes(x = year, y = index, ymin = lcl, ymax = ucl, sd = sd)) +
geom_line() +
stat_effect(threshold = th, reference = ref)
 # plot pairwise differences
change_set <- function(z, base_year) {
n_year <- max(z$dt)
total_change <- lapply(
seq_len(n_year) - 1,
function(i) {
if (i > 0) {
y <- tail(z, -i)
} else {
y <- z
}
data.frame(
from = base_year + i, to = base_year + y$dt,
total = cumsum(y$change), sd = sqrt(cumsum(y$sd ^ 2))
)
}
)
total_change <- do.call(rbind, total_change)
total_change <- rbind(
total_change,
data.frame(
from = total_change$to, to = total_change$from,
total = -total_change$total, sd = total_change$sd
)
)
total_change$lcl <- qnorm(0.025, total_change$total, total_change$sd)
total_change$ucl <- qnorm(0.975, total_change$total, total_change$sd)
return(total_change)
}
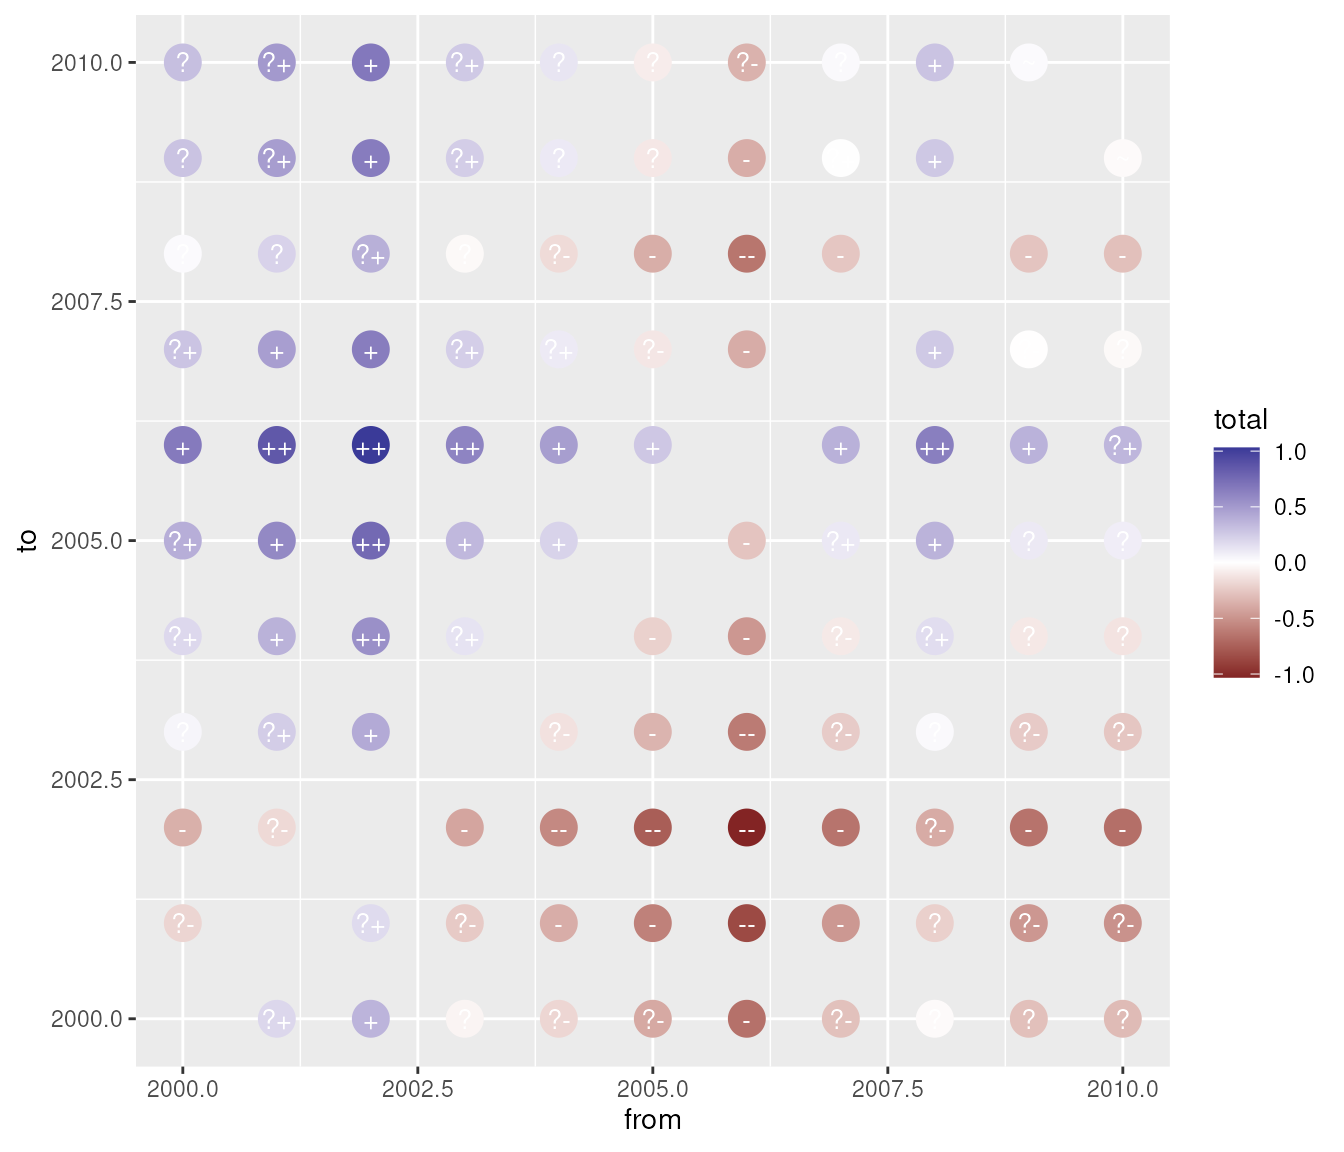
head(trend, 10) |>
change_set(base_year) |>
ggplot(aes(x = from, y = to, ymin = lcl, ymax = ucl)) +
stat_effect(
threshold = th, reference = ref, aes(colour = total), ref_line = "none",
errorbar = FALSE, shape_colour = FALSE
) +
scale_colour_gradient2()
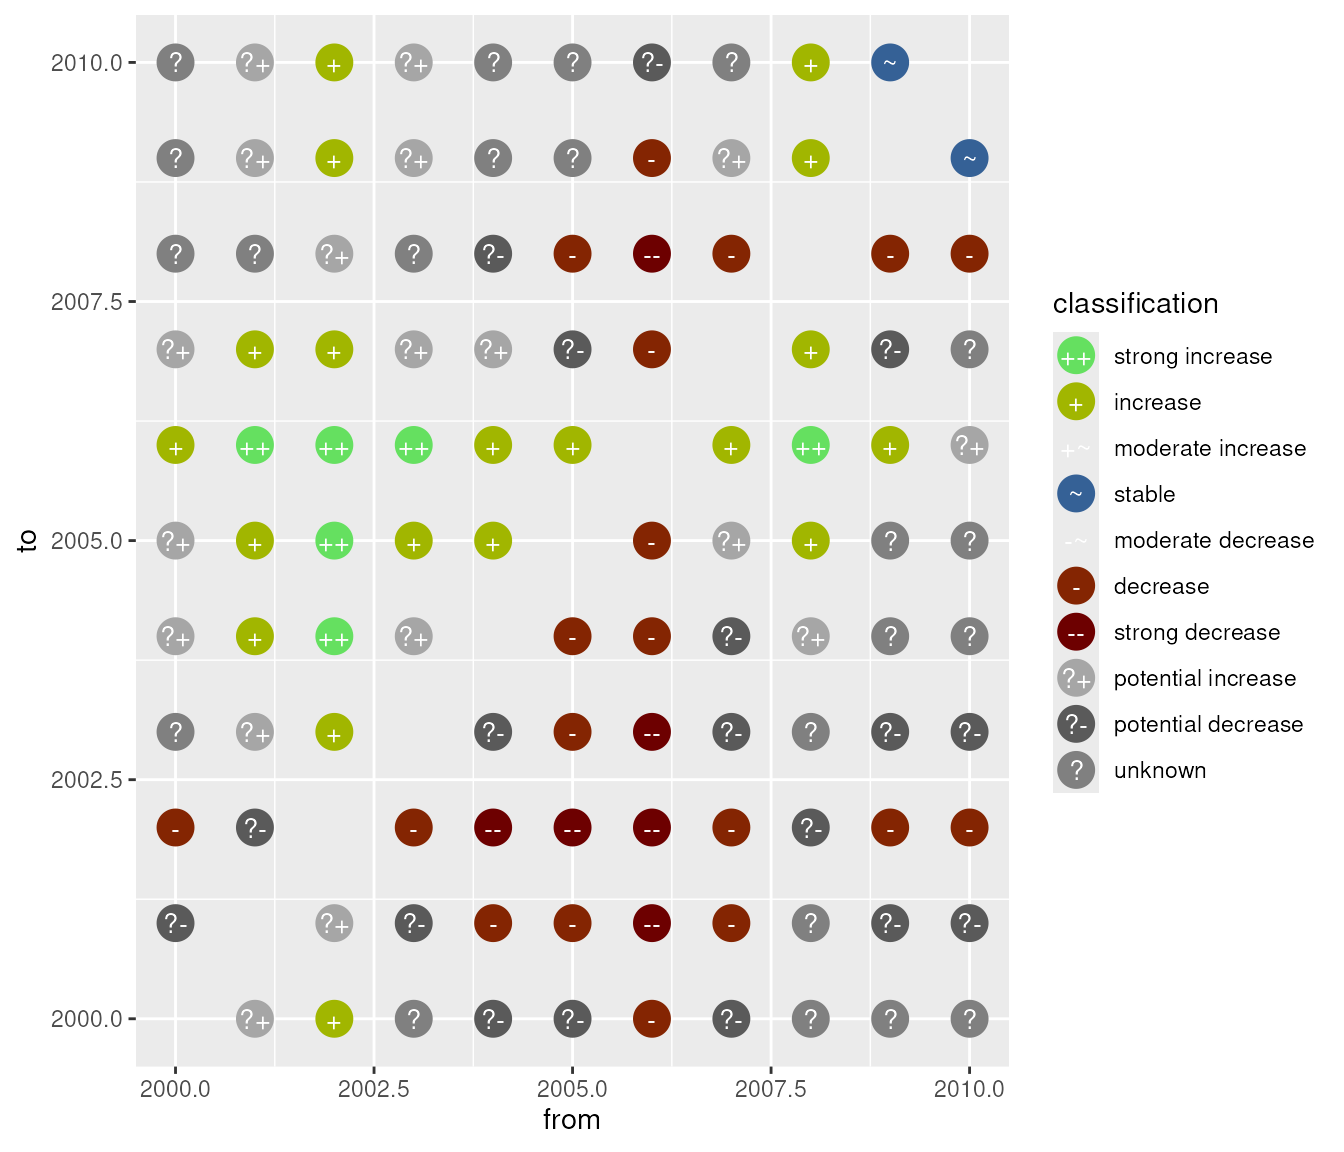
 head(trend, 10) |>
change_set(base_year) |>
ggplot(aes(x = from, y = to, ymin = lcl, ymax = ucl)) +
stat_effect(
threshold = th, reference = ref, ref_line = "none", errorbar = FALSE
)
 options(warn = oldw)