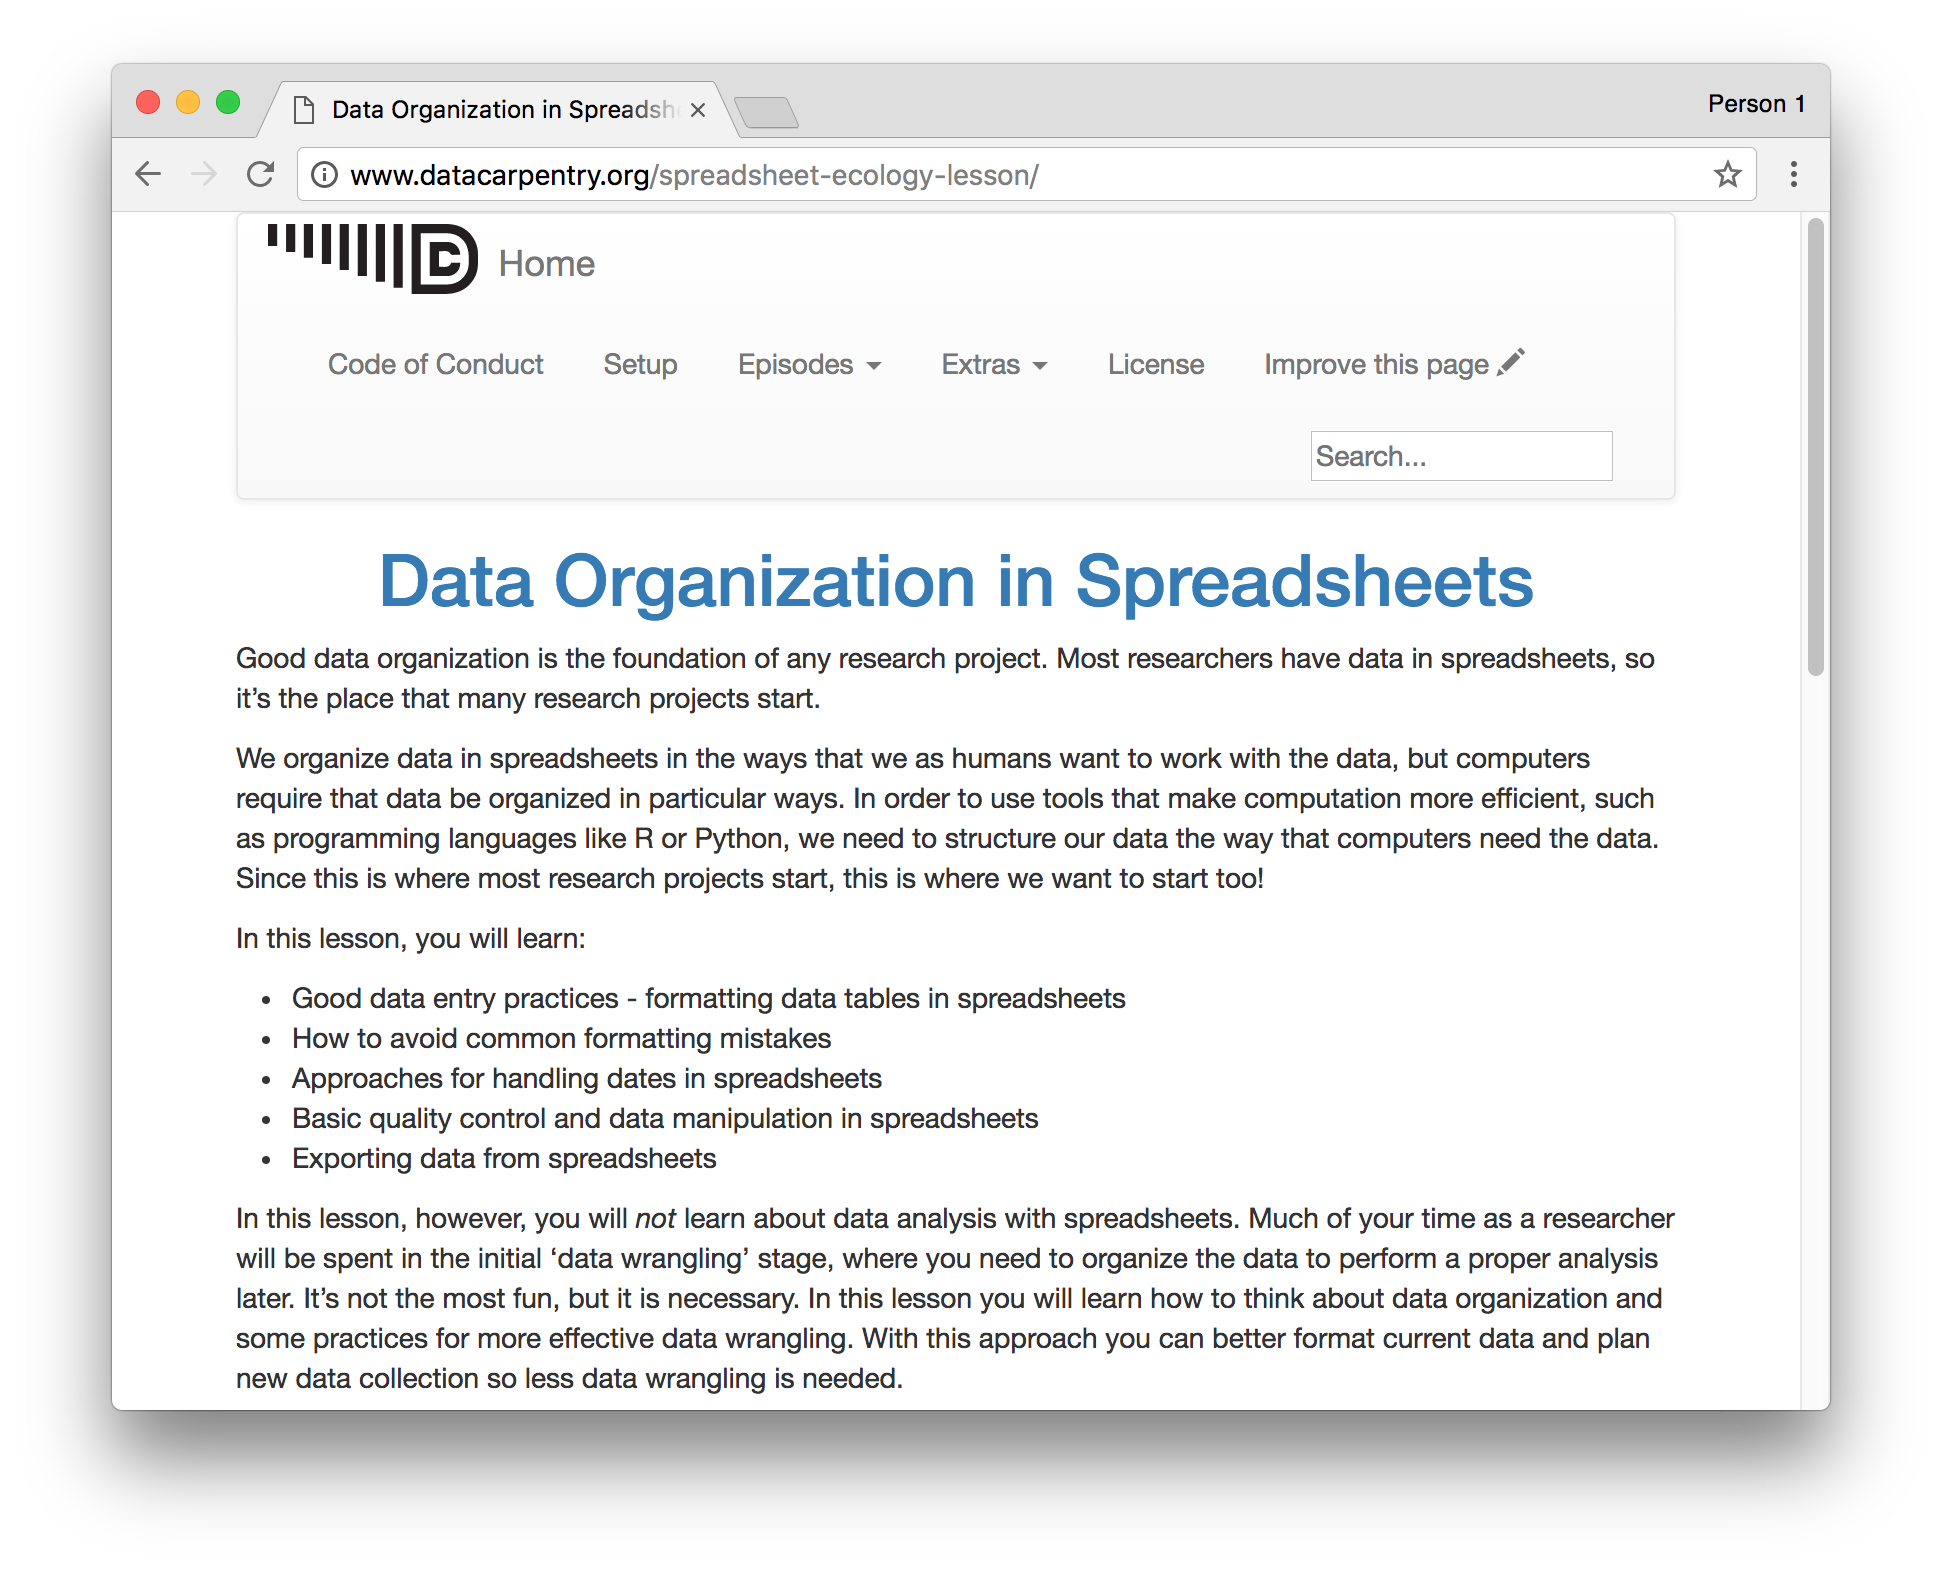
class: middle, center # Tidy data exercise ### Data organization in spreadsheets <br> Adapted from http://datacarpentry.org<br> by [Stijn Van Hoey](https://twitter.com/SVanHoey) and [Peter Desmet](https://twitter.com/peterdesmet)<br> for the Biodiversity Data Management workshop<br> 28 February 2018 <br> [<i class="fa fa-twitter"></i> @LifeWatchINBO](https://twitter.com/LifeWatchINBO) [<i class="fa fa-github"></i> github/inbo](https://github.com/inbo) --- class: middle, center, section_background # Introduction --- class: middle, center background-image: url(./static/images/InnoScholComm_figure_jan2015.png) -- .alert.alert-warning[ ## Tools, tools, tools... ] --- class: middle, center background-image: url(./static/images/good_enough_practices_computational_science.png) .alert.alert-success[ ## good data practices >>> tools ] .footnote[Wilson et al. (2017). <https://doi.org/10.1371/journal.pcbi.1005510>] --- class: middle, center ## In this workshop, we focus on `data` --- class: middle, center ## Data organization is the foundation of your research project --- class: middle, center .emphasize.left[ <i class="fa fa-quote-left fa-3x fa-pull-left"></i> Data that is easy to model,<br> visualize and aggregate ] <br><br><br><br> .emphasize.right[ <i class="fa fa-quote-left fa-3x fa-pull-right"></i> Create the data you wish<br> to see in the world ] --- class: middle, center ## Course from Data Carpentry [](http://www.datacarpentry.org/spreadsheet-ecology-lesson) --- class: middle, center, section_background # Spreadsheets --- class: middle, center ## Survey <https://hackmd.io/s/ryiIwtYIG> --- class: middle, center ## Discussion (and what we will not cover here) --- class: middle, center, section_background # Tidy your data (how to format data in spreadsheets) --- class: middle, center background-image: url(./static/images/tidy_data_paper.png) .footnote[Hadley Wickham (2014) Tidy Data. Journal of Statistical Software, Vol. 59, Issue 10. <https://doi.org/10.18637/jss.v059.i10>] --- class: middle, center ## un-tidy | WWTP | Treatment A | Treatment B | |:------|:-------------:|:-------------:| | Destelbergen | 8. | 6.3 | | Landegem | 7.5 | 5.2 | | Dendermonde | 8.3 | 6.2 | | Eeklo | 6.5 | 7.2 | -- count: false ## tidy | WWTP | Treatment | pH | |:------|:-------------:|:-------------:| | Destelbergen | A | 8. | | Landegem | A | 7.5 | | Dendermonde | A | 8.3 | | Eeklo | A | 6.5 | | Destelbergen | B | 6.3 | | Landegem | B | 5.2 | | Dendermonde | B | 6.2 | | Eeklo | B | 7.2 | --- class: center, top ## tidy .alert.alert-success.left[ * Each `observation` forms a **row** ] | WWTP | Treatment | pH | |:------|:-------------:|:-------------:| | Destelbergen | A | 8. | | Landegem | A | 7.5 | | Dendermonde | A | 8.3 | | Eeklo | A | 6.5 | | Destelbergen | B | 6.3 | | Landegem | B | 5.2 | | Dendermonde | B | 6.2 | | Eeklo | B | 7.2 | --- class: center, top count: false ## tidy .alert.alert-success.left[ * Each `observation` forms a **row**<br> * Each `variable` forms a **column** and contains **values** ] | WWTP | Treatment| pH | Temperature (°C) | |:------|:-------------:|:-------------:|:----:| | Destelbergen | A | 8. | 13.1 | | Landegem | A | 7.5 | 16.9 | | Dendermonde | A | 8.3 | 18.3 | | Eeklo | A | 6.5 | 14.4 | | Destelbergen | B | 6.3 | 17.2 | | Landegem | B | 5.2 | 11.9 | | Dendermonde | B | 6.2 | 17.1 | | Eeklo | B | 7.2 | 19.0 | --- class: center, top count: false ## tidy .alert.alert-success.left[ * Each `observation` forms a **row**<br> * Each `variable` forms a **column** and contains **values**<br> * Each type of `observational unit` forms a **table** ] | WWTP | Treatment| pH | Temperature (°C) | |:------|:-------------:|:-------------:|:----:| | Destelbergen | A | 8. | 13.1 | | Landegem | A | 7.5 | 16.9 | | Dendermonde | A | 8.3 | 18.3 | | Eeklo | A | 6.5 | 14.4 | | ... | ... | ... | ... | | WWTP | country | decimalLatitude | decimalLongitude | |:------|:-------------:|:-------------:|:----:| | Dendermonde | BE | 51.0248 | 4.136 | | Destelbergen | BE | 51.051 | 3.774 | | Landegem |BE | 51.052 | 3.568 | | ... | ... | ... | ... | --- class: middle, center ## Exercise .left[ 1. Pair up with a buddy 2. Download: https://ndownloader.figshare.com/files/2252083 3. Never modify the **raw** data 3. Make it tidy 4. Document the steps ] --- class: middle, center ## Discussion <https://hackmd.io/s/ryiIwtYIG> --- class: middle, center, section_background # Exporting data --- class: middle, center ## Exercise Export your data as a `csv` --- class: middle, center ## Discussion --- class: middle, center, section_background # Importing data --- class: middle, center ## Demo --- class: middle, center, section_background # Resources --- class: left, middle This course: * [Data Organization in Spreadsheets](http://www.datacarpentry.org/spreadsheet-ecology-lesson/), on which this course is based * [GitHub repository for this course](https://github.com/inbo/dwc-in-R) Other resources: * [Data Carpentry](http://www.datacarpentry.org/lessons/) and [Software Carpentry](https://software-carpentry.org/lessons/) courses * rOpenSci [reproducibility guide](http://ropensci.github.io/reproducibility-guide/) * [Many other resources](https://github.com/ecoinfAEET/Reproducibilidad/blob/master/Recursos.Rmd)